Skip to content

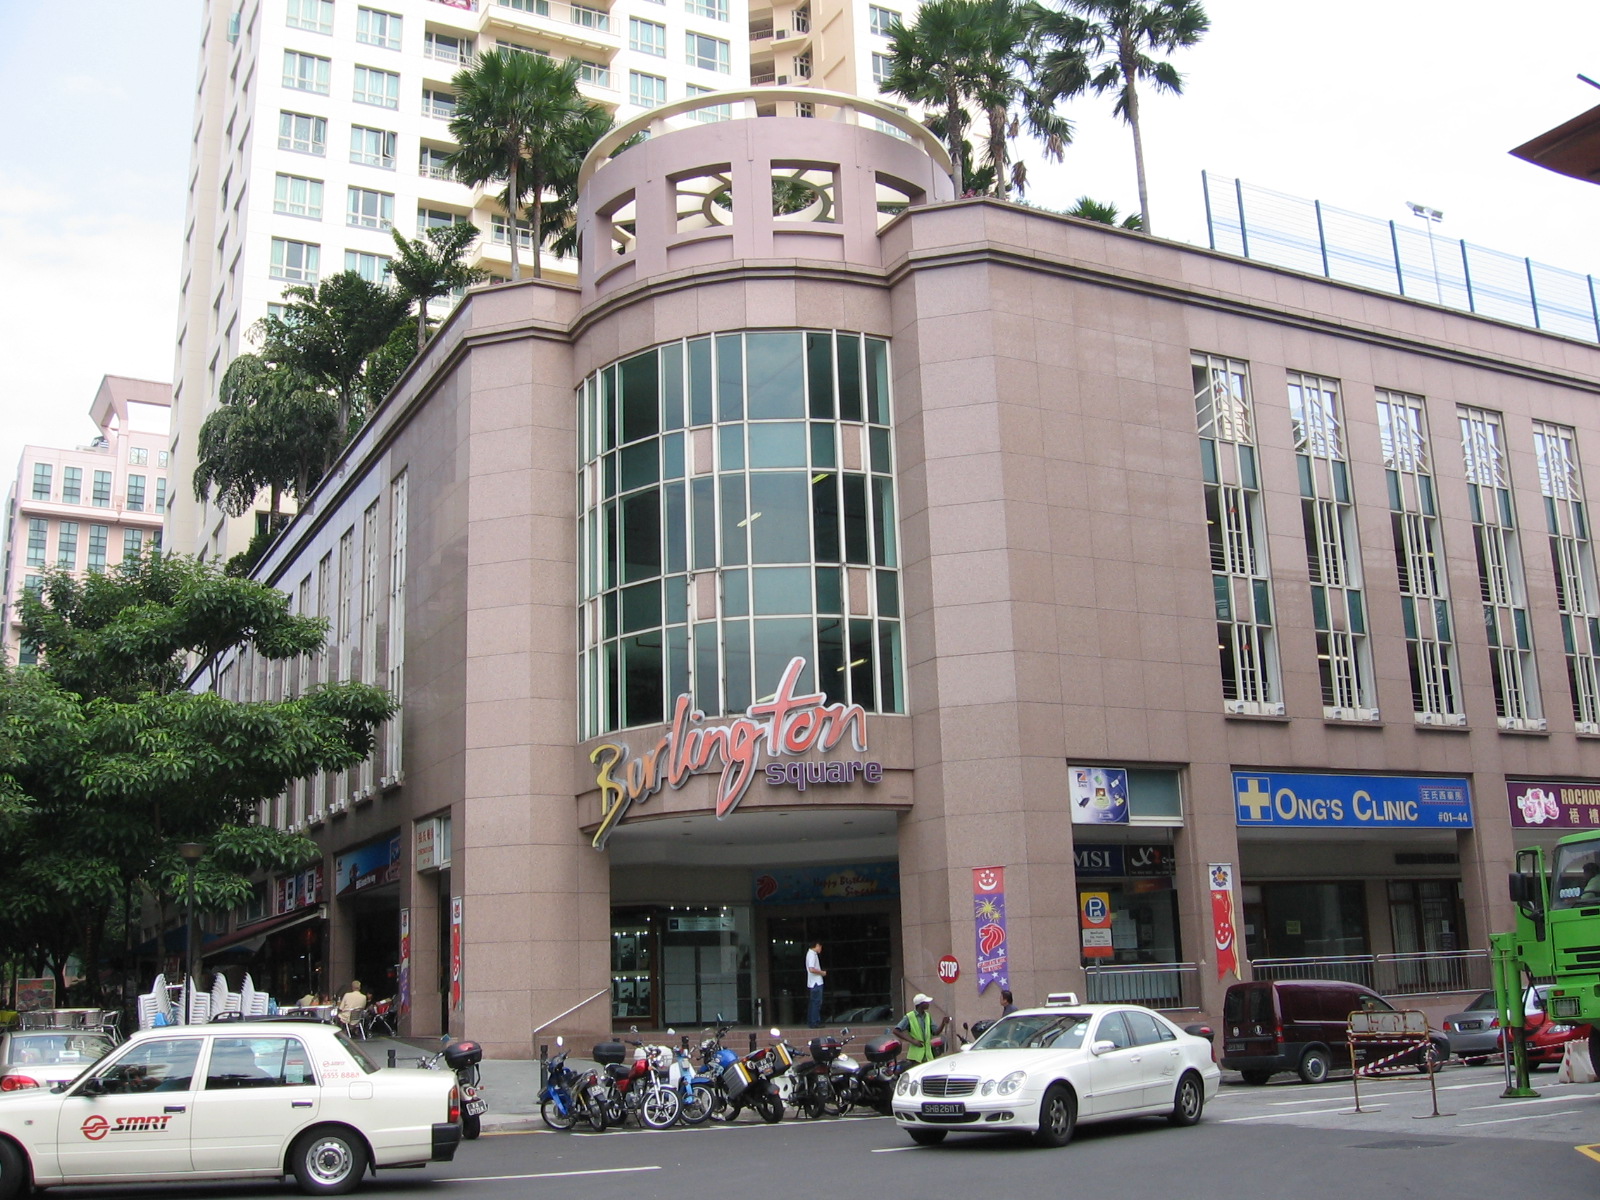
Burlington Square

Developer: Wintrust Investment Pte Ltd (WingTai)
No. Of Units: 179 Residential Units.,66 office units and 56 retail shops
Tenure: 99 Years From 10/06/1996
District: 07
TOP: 1998
Unit Types:
1-bedroom: 667 to 1270 sqft (32 Units)
2-bedroom: 829 to 1302 sqft (110 Units)
3-bedroom: 1066 to 1787 sqft (32 Units)
3-bedroom Penthouse: 1679 to 2002 sqft (2 Units)
4-bedroom Penthouse: 2174 to 3035 sqft (3 Units)

About Burlington Square

Burlington Square at 175 Bencoolen Street offers a unique blend of urban convenience and residential comfort. This 20-storey development, completed in 1998, comprises 179 freehold apartments, ranging from studios to spacious family residences.

Burlington Square’s address translates to excellent connectivity. Residents enjoy easy access to several MRT stations, including Rochor (0.18km), Bugis (0.39km), and Jalan Besar (0.43km), placing them within minutes of Singapore’s bustling heart. The surrounding area is also well-served by buses, making exploration of the city a breeze.

Beyond its convenient location, Burlington Square boasts amenities that cater to the modern lifestyle. The development features a swimming pool, a gym, and a communal area, providing residents with opportunities to relax and socialize. Additionally, the presence of on-site parking removes the stress of finding a spot in the busy city.

Stepping outside Burlington Square, residents find themselves surrounded by diverse options. From the historical charm of Kampong Glam to the trendy shops of Bugis, the neighbourhood offers something for everyone. Foodies will delight in the abundance of local and international restaurants, while art enthusiasts can explore the nearby Nanyang Academy of Fine Arts.

Whether you’re a young professional seeking a vibrant urban life or a family looking for a comfortable and well-connected home, Burlington Square offers an attractive option. With its blend of modern amenities, convenient location, and access to the best of Singapore, this development stands as a testament to the exciting possibilities that city living presents.

Burlington Square Location Map

Burlington Square Street View

Amenities Nearby Burlington Square

TypeAmenitiesApprox Distance
MRTRochor (DT13)0.19km
Bugis (DT14 EW12)0.4km
Jalan Besar (DT22)0.47km
Bencoolen (DT21)0.49km
Bras Basah (CC2)0.62km
Little India (DT12 NE7)0.62km
Dhoby Ghaut (CC1 NS24 NE6)0.91km
City Hall (EW13 NS25)0.99km
Esplanade (CC3)1.01km
Farrer Park (NE8)1.1km
Nicoll Highway (CC5)1.12km
Lavender (EW11)1.26km
Promenade (CC4 DT15)1.33km
Fort Canning (DT20)1.45km
Clarke Quay (NE5)1.58km
Bendemeer (DT23)1.62km
Somerset (NS23)1.66km
Raffles Place (EW14 NS26)1.98km
Bus StopsOpp Burlington Sq (Bus: 139, 64, 65)0.1km
Fortune Ctr (Bus: 147, 131, 166, 56, 857, 980)0.15km
Rochor Stn (Bus: 980, 851, 960, 170, 170A, 57, 66, 66A, 66B, 67, 48, 23)0.16km
Fu Lu Shou Cplx (Bus: 57, 48, 980, 960, 851, 170, 170A)0.22km
Opp Prime Ctr (Bus: 56)0.25km
Primary SchoolsStamford Primary School0.55km
St. Margaret's Primary School0.74km
Farrer Park Primary School1.15km
Anglo-Chinese School (Junior)1.53km
St. Joseph's Institution Junior1.9km
Secondary SchoolsSchool Of The Arts, Singapore0.55km
Shopping MallsSim Lim Square0.09km
Bugis Village0.32km
The Verge0.35km
Bugis+0.36km
Parklane Shopping Mall0.4km
Paradiz0.45km
Pomo0.45km
Bugis Junction0.47km
Tekka Market0.5km
Bugis Point0.54km
Bugis Cube0.56km
Duo Tower And Duo Galleria0.67km
Shaw Towers0.8km
Plaza Singapura0.86km
The South Beach0.9km
Raffles City Tower0.91km
Mustafa Centre0.92km
Serangoon Plaza0.99km
Suntec City Mall1.04km
Singapore Shopping Centre1.06km
City Square Mall1.12km
Excelsior Shopping Centre1.18km
Peninsula Shopping Complex1.19km
Orchard Central1.23km
West Coast Plaza1.23km
Funan DigitaLife Mall1.25km
Orchard Plaza1.29km
OG Orchard Point1.36km
Marina Square1.36km
Golden Mile Shopping Centre1.39km
Millenia Walk1.4km
The Centrepoint1.43km
Orchard Gateway1.49km
Liang Court1.49km
UE Shopping Mall1.6km
313 @ Somerset1.6km
Central1.64km
Orchard Shopping Centre1.65km
Robertson Walk1.7km
The Heeren Shops1.71km
Riverside Point1.73km
268 Orchard Road1.76km
Knightsbridge1.82km
Mandarin Gallery1.82km
Paragon1.86km
Ngee Ann City1,85km
Furama City Centre1.97km
United Square Shopping Mall1.99km
Takashimaya Shopping Centre2.0km
Groceries & SupermartsSheng Siong Hypermarket (The Verge)0.27km
NTUC Fairprice (Rochor Centre)0.28km
Cold Storage Pomo Centre0.45km
Cold Storage Bugis Junction0.46km
Giant (New World Centre)0.78km
Jason's Market Place0.93km
NTUC Fairprice (City Square Mall)1.12km
NTUC Fairprice (Kitchener Complex)1.2km
Cold Storage Funan DigitaLife Mall1.25km
Cold Storage Centrepoint1.43km
NTUC Fairprice (Cambridge Blk 43)1.5km
Cold Storage UE Square1.58km
NTUC Fairprice (Orchard Grand Court)1.67km
Paragon Market Place1.86km
Cold Storage United Square1.99km

Burlington Square Resale/Rental Prices


Let’s Discuss Your Property Plans

Interested in This Property?

Buying, selling or renting? Get a free consultation with realtors with a background in interior and lighting design. We’ll discuss your goals and help you assess your options—from pricing and timelines to layout practicality and space potential.

Share your contact details below, and we will get in touch to understand your needs and suggest the next steps. No pressure. No obligation to proceed.

Other Topics That May Interest You

BURLINGTON SQUARE Sales and Rental Transactions

Share a link to the applied filters and selected section. Figures update over time.

Property market snapshot

Prices, rents and activity

Oct 2025 – Sep 2026

Size and bedroom options show recorded transactions in the selected period; they do not describe every unit type in the development. The period ends before the current month. Sales filters apply to sales; bedroom selection applies to rentals. The same filters apply to the figures, charts and transaction tables below.

BURLINGTON SQUARE · Oct 2025 – Sep 2026
The imported URA data contains 6 sales and 12 rental contracts matching the selected period and filters.

Median single-unit sale price: S$1,519,000, based on 6 sales. Median strata sale price per square foot: S$1,656 / sqft, based on 6 sales. Median monthly rent: S$3,800, based on 12 rental contracts.

Sale type: All sale types. Sales unit size: All unit sizes. Rental bedrooms: 1 bedroom. Historical transactions describe this sample, not current asking prices, rental listings or a valuation.

Median sale priceS$1,519,0006 single-unit sales · All sale types
Median sale PSFS$1,656 / sqft6 strata sales · All sale types
Median monthly rentS$3,80012 rental contracts
Recorded activity6 sale records12 rental contracts · selected period

The sale cards combine sale types. Choose New Sale, Sub Sale or Resale for a focused comparison; the size breakdown keeps those types separate.

Sale prices by unit size

Median transaction price; sale types shown separately. Bars share a zero-based scale within this panel. Select a size label to filter sales.

500–749 sqftResale · 1 sale
S$1,240,000Middle 50%: Limited sample — fewer than 5 recordsMedian PSF: S$1,670 · 1 sale
750–999 sqftResale · 3 sales
S$1,500,000Middle 50%: Limited sample — fewer than 5 recordsMedian PSF: S$1,642 · 3 sales
1,000–1,499 sqftResale · 1 sale
S$1,778,888Middle 50%: Limited sample — fewer than 5 recordsMedian PSF: S$1,669 · 1 sale
2,000–2,999 sqftResale · 1 sale
S$2,775,000Middle 50%: Limited sample — fewer than 5 recordsMedian PSF: S$1,276 · 1 sale
Exact sales breakdown and price extremes
Size / typeSalesMedian priceMiddle 50%Min–max priceMedian PSF
500–749 sqft · Resale1S$1,240,000Limited sample — fewer than 5 recordsS$1,240,000 – S$1,240,000S$1,670
750–999 sqft · Resale3S$1,500,000Limited sample — fewer than 5 recordsS$1,300,000 – S$1,538,000S$1,642
1,000–1,499 sqft · Resale1S$1,778,888Limited sample — fewer than 5 recordsS$1,778,888 – S$1,778,888S$1,669
2,000–2,999 sqft · Resale1S$2,775,000Limited sample — fewer than 5 recordsS$2,775,000 – S$2,775,000S$1,276

Monthly rents by bedrooms

Median monthly rent. Bars share a zero-based scale within this panel. Select a bedroom label to filter rentals.

1 bedroom12 rental contracts
S$3,800 / monthMiddle 50%: S$3,713 – S$3,900
Exact rental breakdown and rent extremes
BedroomsContractsMedian rentMiddle 50%Min–max rent
1 bedroom12S$3,800S$3,713 – S$3,900S$3,207 – S$4,200
How to read these figures

Medians describe the transactions in this view, not a valuation or a change in every home’s value. Middle 50% is the 25th–75th percentile, shown only with at least five observations; smaller groups are flagged. Minima and maxima are available in the breakdown tables. Percentiles use linear interpolation.

Price and PSF statistics include only sales explicitly recorded as one unit. Bulk sales and records with an unknown unit count remain in the detailed table when All unit sizes is selected. PSF uses unrounded strata area; size bands use rounded square feet. A size band does not identify bedrooms, penthouses, layout or unit condition.

Rental bedrooms are as reported; missing or non-numeric values are Not stated. Rental sizes are ranges. Rents and sales are separate samples: no project yield or exact rental PSF is inferred.

Discuss this property

Get a price or rental assessment

Request an assessment for your home or discuss rental potential based on comparable transactions.

BURLINGTON SQUARE · Oct 2025 – Sep 2026 · All sale types · All unit sizes · 1 bedroom

Your enquiry will include the property, page URL and transaction filters shown above. Yield-calculator amounts are excluded.

Test your assumptions

Rental yield calculator

Enter a purchase price and monthly rent for the same home. Results update as you type. Your assumptions stay in this page while you change transaction filters; they are not submitted or saved.

Rental reference in the selected view: median S$3,800 / month from 12 contracts. These contracts may cover different-sized homes. Check the bedroom breakdown and records before choosing your rent assumption.

Optional vacancy and running expenses

Blank expense fields count as zero. Enter annual costs for the full year; they are not reduced during vacancy.

Enter purchase price and monthly rent to calculate.

Calculation and exclusions

Gross rental yield = monthly rent × 12 ÷ purchase price × 100.

Annual income after entered expenses = monthly rent × (12 − vacant months) − monthly maintenance × 12 − annual property tax − other annual running costs. Yield after entered expenses divides that income by purchase price.

Results use your assumptions and are indicative, before financing and personal income tax. The denominator excludes stamp duties, legal fees, renovation, furnishing and other acquisition costs. Include recurring insurance, repairs and letting costs in other running costs where relevant. No appreciation, mortgage repayment or return on equity is calculated. Historical rental contracts do not guarantee future rent or occupancy.

History and activity

How transactions changed over time

Monthly · Oct 2025 – Sep 2026

The active filters also apply here. Value axes start at zero and adjust to the selected records; check their labels when comparing views. Each point shows a period median; the bars below count recorded sales or rental contracts. Different sale types and rental bedroom counts have separate series. These changes can reflect the mix of homes transacted, rather than appreciation of an individual home.

Sale PSF history

Median S$/sqft for single-unit strata sales, by sale type.

Resale
Median S$/sqftS$0S$470S$940S$1,410S$1,880Oct 2025 · Resale · S$1,787 / sqft · 1 sale · limited sampleApr 2026 · Resale · S$1,459 / sqft · 2 sales · limited sampleMay 2026 · Resale · S$1,669 / sqft · 2 sales · limited sampleSep 2026 · Resale · S$1,510 / sqft · 1 sale · limited sampleSale records per period1Oct 250Nov 250Dec 250Jan 260Feb 260Mar 262Apr 262May 260Jun 260Jul 260Aug 261Sep 26

On a narrow screen, swipe the chart horizontally. Tap a point/bar or use the period controls for exact figures.

Sep 2026

1 sale records in this period.

  • Resale: S$1,510 / sqft · 1 sale · limited sample
Exact history and activity table
PeriodResale median PSFResale salesSale records
Oct 2025S$1,7871 (limited)1
Nov 2025—00
Dec 2025—00
Jan 2026—00
Feb 2026—00
Mar 2026—00
Apr 2026S$1,4592 (limited)2
May 2026S$1,6692 (limited)2
Jun 2026—00
Jul 2026—00
Aug 2026—00
Sep 2026S$1,5101 (limited)1

Monthly rent history

Median monthly rent in S$, by reported bedroom count.

1 bedroom
Median S$/monthS$0S$1,100S$2,200S$3,300S$4,400Nov 2025 · 1 bedroom · S$3,900 / month · 1 rental contract · limited sampleDec 2025 · 1 bedroom · S$3,800 / month · 3 rental contracts · limited sampleJan 2026 · 1 bedroom · S$4,000 / month · 2 rental contracts · limited sampleMar 2026 · 1 bedroom · S$3,600 / month · 1 rental contract · limited sampleApr 2026 · 1 bedroom · S$3,554 / month · 2 rental contracts · limited sampleMay 2026 · 1 bedroom · S$3,800 / month · 1 rental contract · limited sampleAug 2026 · 1 bedroom · S$3,625 / month · 2 rental contracts · limited sampleRental contracts per period0Oct 251Nov 253Dec 252Jan 260Feb 261Mar 262Apr 261May 260Jun 260Jul 262Aug 260Sep 26

On a narrow screen, swipe the chart horizontally. Tap a point/bar or use the period controls for exact figures.

Aug 2026

2 rental contracts in this period.

  • 1 bedroom: S$3,625 / month · 2 rental contracts · limited sample
Exact history and activity table
Period1 bedroom median rent1 bedroom rental contractsRental contracts
Oct 2025—00
Nov 2025S$3,9001 (limited)1
Dec 2025S$3,8003 (limited)3
Jan 2026S$4,0002 (limited)2
Feb 2026—00
Mar 2026S$3,6001 (limited)1
Apr 2026S$3,5542 (limited)2
May 2026S$3,8001 (limited)1
Jun 2026—00
Jul 2026—00
Aug 2026S$3,6252 (limited)2
Sep 2026—00

Filled points have at least five qualifying observations; hollow points have fewer than five. Lines join only adjacent filled points. Gaps are not estimated or filled with zeros. For five-year views, edge quarters marked * may contain fewer than three selected months. Sale activity bars include all selected sale records; PSF points use only qualifying single-unit strata sales.

Individual sale comparison

Sale price versus unit size

Oct 2025 – Sep 2026 · 6 qualifying sale records. The period, sale-type and unit-size filters above apply. Bedroom filters affect rentals only

Each plotted position represents one or more sales at that size and price. Tap a marker or select a record below for its contract month, floor range and PSF. Markers with a number contain multiple records; none are discarded.

Resale
Total sale price (S$)S$00S$720,000560S$1.44m1,120S$2.16m1,680S$2.88m2,240Unit size (sqft)#1 · Sep 2026 · Resale · 861 sqft · S$1,300,000 · floor 16-20#2 · May 2026 · Resale · 743 sqft · S$1,240,000 · floor 01-05#3 · May 2026 · Resale · 1,066 sqft · S$1,778,888 · floor 16-20#4 · Apr 2026 · Resale · 2,174 sqft · S$2,775,000 · floor 16-20#5 · Apr 2026 · Resale · 936 sqft · S$1,538,000 · floor 16-20#6 · Oct 2025 · Resale · 840 sqft · S$1,500,000 · floor 11-15

Both axes start at zero and adjust to the selected sales. All qualifying sales, including extreme values, remain shown. Swipe horizontally on a narrow screen. Identical positions are grouped without moving the data points. Nearby markers can overlap; the selector and table retain every eligible record.

#1 · Sep 2026 · Resale · 861 sqft · S$1,300,000 · floor 16-20

S$1,510 / sqft

Exact plotted sales table
RecordContract monthSale typeFloor rangeSize (sqft)Price (S$)PSF (S$/sqft)
1Sep 2026Resale16-208611,300,0001,510
2May 2026Resale01-057431,240,0001,670
3May 2026Resale16-201,0661,778,8881,669
4Apr 2026Resale16-202,1742,775,0001,276
5Apr 2026Resale16-209361,538,0001,642
6Oct 2025Resale11-158401,500,0001,787

0 selected records excluded from this plot: only explicitly single-unit strata sales with positive numeric prices and areas qualify. Size positions and PSF use unrounded area; displayed sizes are rounded. Record numbers refer to this view and are not unit identifiers. No fitted price or valuation is inferred.

Sales Transactions

Contract monthType of saleFloor rangeArea (sqft)Sale price (S$)Price (S$/sqft)Units in transaction
Sep 2026Resale16-208611,300,0001,5101
May 2026Resale01-057431,240,0001,6701
May 2026Resale16-201,0661,778,8881,6691
Apr 2026Resale16-202,1742,775,0001,2761
Apr 2026Resale16-209361,538,0001,6421
Oct 2025Resale11-158401,500,0001,7871

Last downloaded: 30 Oct 2026, 12:20 SGT. 6 matching records in the selected period.

Rental Contracts

Latest recorded lease start: Aug 2026.

Lease start monthBedroomsArea range (sqft)Monthly rent (S$)
Aug 20261600-7003,750
Aug 20261600-7003,500
May 20261700-8003,800
Apr 20261600-7003,207
Apr 20261700-8003,900
Mar 20261600-7003,600
Jan 20261600-7003,800
Jan 20261600-7004,200
Dec 20251600-7003,800
Dec 20251700-8003,800

Last downloaded: 27 Oct 2026, 17:07 SGT. 12 matching records in the selected period.

Source: Urban Redevelopment Authority (URA), accessed through the URA Data Service. Data made available under the Singapore Open Data Licence. Areas are rounded; rental areas are ranges. Records may be revised and do not identify exact units. Multiple transactions in the same month are not ordered by day. These records are historical transactions, not current listings or valuations.

Site Map

Site plan of Burlington Square featuring distinct zones including an office tower along Bencoolen Street, a residential tower with a drop-off point, and recreational facilities such as a tennis court, main pool, and bubble pool near Prinsep Street; landscaped walkways connect to Albert Mall.

Burlington Square 5th Storey Full Floor Plate Floor Plan

Floor plan of the 5th storey residential tower at Burlington Square, showcasing various unit layouts ranging from 743 to 1,453 square feet, including unit numbers, bedroom configurations, private enclosed spaces (PES), and amenities like a gym, multi-purpose hall, and lift lobbies across Towers A and B.

Burlington Square 6th Storey Full Floor Plate Floor Plan

6th storey floor plan of the residential tower at Burlington Square, highlighting unit layouts numbered #06-01 to #06-12 with areas ranging from 667 to 1,119 square feet, and featuring various apartment types including B1, A1, B2, B4, and C2, as well as common facilities like lift lobbies and access corridors connecting Towers A and B.

Burlington Square 7th to 16th Storey Full Floor Plate Floor Plan

Typical 7th to 16th storey floor plan of the residential tower at Burlington Square, detailing unit layouts from #07-01 to #16-12 with areas ranging between 667 and 1,119 square feet, and showcasing various apartment types such as A1, A2, B1, B2, B4, C1, and C2, along with labeled master bedrooms, living/dining areas, kitchens, and lift lobbies across Towers A and B.

Burlington Square 17th to 18th Storey Full Floor Plate Floor Plan

Typical 17th to 18th storey floor plan of the residential tower at Burlington Square, displaying unit layouts from #17-01 to #18-12 with sizes ranging from 667 to 1,119 square feet, and apartment types including A2, A3, B1, B2, B3, B4, and C2; the diagram includes labeled bedrooms, kitchens, living/dining areas, and lift lobbies for Towers A and B.

Burlington Square 19th Storey Full Floor Plate Floor Plan

19th storey floor plan of the residential tower at Burlington Square, detailing units #19-01 to #19-11 with approximate areas ranging from 689 to 1,787 square feet, showcasing apartment types A2, A3, B3, B4, C1, C2, and C3r; includes labeled rooms, kitchens, living/dining areas, lift lobbies, and private terraces in selected units.

Burlington Square 20th Storey Full Floor Plate Floor Plan

20th storey floor plan of the residential tower at Burlington Square, illustrating unit layouts from #20-01 to #20-10 with areas ranging from 689 to 3,035 square feet, and apartment types including A1b, A2, C4r, D1r, D2r, and D3r; plan features multiple bedrooms, private terraces, utility rooms, and clearly marked living/dining areas and lift lobbies.

Burlington Square Roof Terrace Full Floor Plate Floor Plan

Roof plan of the residential tower at Burlington Square, featuring designated private roof terraces for units #20-01, #20-05, #20-06, #20-09, and #20-10, along with areas marked as reinforced concrete (R.C.) flat roofs and connecting staircases to upper-level spaces.