Architectural Concept At Forest Woods
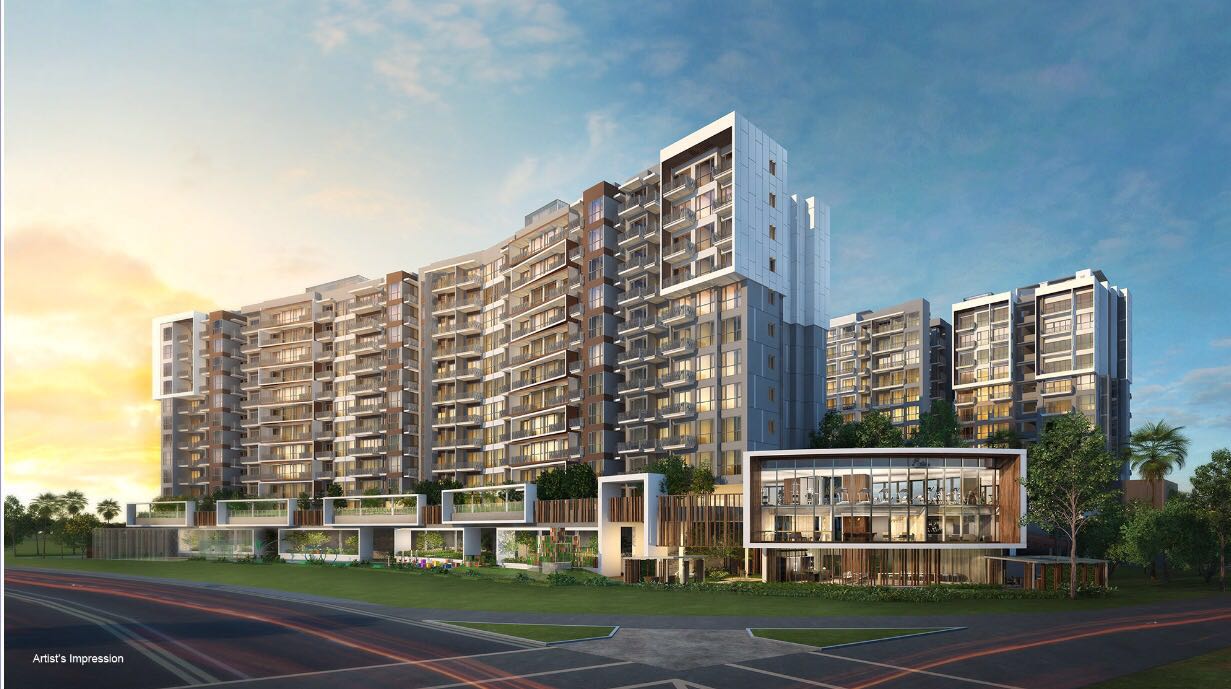
Inspired by the historical context of “Serangoon” which is thought to be derived from the ranggong bird, a species of stork which abounded in the riverine swamps around Serangoon River or the Rangoon River, the development aims to capture the sense of nostalgia and lush shades of forest that is present on the existing site.
The architectural language is kept to pure forms, bridging between the landscape and the urban. The box and frame design language takes a humbler approach to complement the landscape, allowing the development to grow into a living forest. The riparian nature of the development immediately stands out among the urban neighborhood, recreating the experience of a sanctuary landscape in the heart of the Serangoon estate.
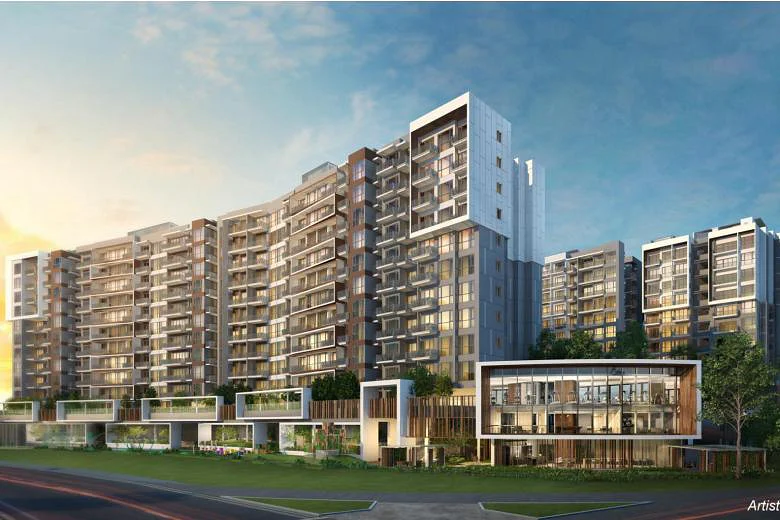
The project comprises 7 blocks of 12-strorey residential towers, with a total of 519 units. The blocks are purposefully arranged to maximize block-to-block spacing. The site planning concept aims to create spaciousness within an odd-shaped site. In terms of the architectural design, the blocks are articulated by alternating frames and overlapping lines of varying depths, to create intertwining envelopes of overhanging ledges. The façade is complemented by the vibrant blue-&-green landscape that melds from a “forest walk” theme at the eastern end of the e-deck, with a more orderly and manicured design at the western end.
Landscape Concept At Forest Woods
The landscape concept is to offer a lifestyle that is to engage more with the nature. A living that is among the woods, celebrating the daily enjoyment together with the large range of native and exotic landscape. The development is more than a net for the buyers. It’s also a platform for the kids to grow up with the nature, a place that they call home.
Forest Woods Location Map
Forest Woods Street View
Forest Woods Resale/Rental Prices
Let’s Discuss Your Property Plans
Interested in This Property?
Buying, selling or renting? Get a free consultation with realtors with a background in interior and lighting design. We’ll discuss your goals and help you assess your options—from pricing and timelines to layout practicality and space potential.
Share your contact details below, and we will get in touch to understand your needs and suggest the next steps. No pressure. No obligation to proceed.
Other Topics That May Interest You
FOREST WOODS Sales and Rental Transactions
Share a link to the applied filters and selected section. Figures update over time.
Property market snapshot
Prices, rents and activity
Nov 2025 – Oct 2026
Size and bedroom options show recorded transactions in the selected period; they do not describe every unit type in the development. The period ends before the current month. Sales filters apply to sales; bedroom selection applies to rentals. The same filters apply to the figures, charts and transaction tables below.
FOREST WOODS · Nov 2025 – Oct 2026 The imported URA data contains 19 sales and 28 rental contracts matching the selected period and filters.
Median single-unit sale price: S$2,088,888, based on 19 sales. Median strata sale price per square foot: S$2,142 / sqft, based on 19 sales. Median monthly rent: S$3,300, based on 28 rental contracts.
Sale type: All sale types. Sales unit size: All unit sizes. Rental bedrooms: 1 bedroom. Historical transactions describe this sample, not current asking prices, rental listings or a valuation.
Median sale priceS$2,088,88819 single-unit sales · All sale types
Median sale PSFS$2,142 / sqft19 strata sales · All sale types
Median monthly rentS$3,30028 rental contracts
Recorded activity19 sale records28 rental contracts · selected period
The sale cards combine sale types. Choose New Sale, Sub Sale or Resale for a focused comparison; the size breakdown keeps those types separate.
Sale prices by unit size
Median transaction price; sale types shown separately. Bars share a zero-based scale within this panel. Select a size label to filter sales.
Medians describe the transactions in this view, not a valuation or a change in every home’s value. Middle 50% is the 25th–75th percentile, shown only with at least five observations; smaller groups are flagged. Minima and maxima are available in the breakdown tables. Percentiles use linear interpolation.
Price and PSF statistics include only sales explicitly recorded as one unit. Bulk sales and records with an unknown unit count remain in the detailed table when All unit sizes is selected. PSF uses unrounded strata area; size bands use rounded square feet. A size band does not identify bedrooms, penthouses, layout or unit condition.
Rental bedrooms are as reported; missing or non-numeric values are Not stated. Rental sizes are ranges. Rents and sales are separate samples: no project yield or exact rental PSF is inferred.
Discuss this property
Get a price or rental assessment
Request an assessment for your home or discuss rental potential based on comparable transactions.
FOREST WOODS · Nov 2025 – Oct 2026 · All sale types · All unit sizes · 1 bedroom
Your enquiry will include the property, page URL and transaction filters shown above. Yield-calculator amounts are excluded.
Test your assumptions
Rental yield calculator
Enter a purchase price and monthly rent for the same home. Results update as you type. Your assumptions stay in this page while you change transaction filters; they are not submitted or saved.
Rental reference in the selected view: median S$3,300 / month from 28 contracts. These contracts may cover different-sized homes. Check the bedroom breakdown and records before choosing your rent assumption.
Optional vacancy and running expenses
Blank expense fields count as zero. Enter annual costs for the full year; they are not reduced during vacancy.
Enter purchase price and monthly rent to calculate.
Annual income after entered expenses = monthly rent × (12 − vacant months) − monthly maintenance × 12 − annual property tax − other annual running costs. Yield after entered expenses divides that income by purchase price.
Results use your assumptions and are indicative, before financing and personal income tax. The denominator excludes stamp duties, legal fees, renovation, furnishing and other acquisition costs. Include recurring insurance, repairs and letting costs in other running costs where relevant. No appreciation, mortgage repayment or return on equity is calculated. Historical rental contracts do not guarantee future rent or occupancy.
History and activity
How transactions changed over time
Monthly · Nov 2025 – Oct 2026
The active filters also apply here. Value axes start at zero and adjust to the selected records; check their labels when comparing views. Each point shows a period median; the bars below count recorded sales or rental contracts. Different sale types and rental bedroom counts have separate series. These changes can reflect the mix of homes transacted, rather than appreciation of an individual home.
Sale PSF history
Median S$/sqft for single-unit strata sales, by sale type.
Resale
On a narrow screen, swipe the chart horizontally. Tap a point/bar or use the period controls for exact figures.
Oct 2026
1 sale records in this period.
Resale: S$2,323 / sqft · 1 sale · limited sample
Exact history and activity table
Period
Resale median PSF
Resale sales
Sale records
Nov 2025
S$1,800
1 (limited)
1
Dec 2025
S$2,173
3 (limited)
3
Jan 2026
S$2,194
2 (limited)
2
Feb 2026
S$2,095
2 (limited)
2
Mar 2026
S$1,854
1 (limited)
1
Apr 2026
S$2,000
1 (limited)
1
May 2026
S$2,258
2 (limited)
2
Jun 2026
S$2,075
2 (limited)
2
Jul 2026
—
0
0
Aug 2026
S$2,142
3 (limited)
3
Sep 2026
S$2,326
1 (limited)
1
Oct 2026
S$2,323
1 (limited)
1
Monthly rent history
Median monthly rent in S$, by reported bedroom count.
1 bedroom
On a narrow screen, swipe the chart horizontally. Tap a point/bar or use the period controls for exact figures.
Filled points have at least five qualifying observations; hollow points have fewer than five. Lines join only adjacent filled points. Gaps are not estimated or filled with zeros. For five-year views, edge quarters marked * may contain fewer than three selected months. Sale activity bars include all selected sale records; PSF points use only qualifying single-unit strata sales.
Individual sale comparison
Sale price versus unit size
Nov 2025 – Oct 2026 · 19 qualifying sale records. The period, sale-type and unit-size filters above apply. Bedroom filters affect rentals only
Each plotted position represents one or more sales at that size and price. Tap a marker or select a record below for its contract month, floor range and PSF. Markers with a number contain multiple records; none are discarded.
Resale
Both axes start at zero and adjust to the selected sales. All qualifying sales, including extreme values, remain shown. Swipe horizontally on a narrow screen. Identical positions are grouped without moving the data points. Nearby markers can overlap; the selector and table retain every eligible record.
0 selected records excluded from this plot: only explicitly single-unit strata sales with positive numeric prices and areas qualify. Size positions and PSF use unrounded area; displayed sizes are rounded. Record numbers refer to this view and are not unit identifiers. No fitted price or valuation is inferred.
Sales Transactions
Contract month
Type of sale
Floor range
Area (sqft)
Sale price (S$)
Price (S$/sqft)
Units in transaction
Mar 2026
Resale
01-05
506
938,000
1,854
1
Feb 2026
Resale
01-05
603
1,240,000
2,057
1
Feb 2026
Resale
01-05
980
2,088,888
2,133
1
Jan 2026
Resale
06-10
635
1,250,000
1,968
1
Jan 2026
Resale
06-10
1,281
3,100,000
2,420
1
Dec 2025
Resale
06-10
936
2,143,000
2,288
1
Dec 2025
Resale
01-05
1,389
2,850,000
2,053
1
Dec 2025
Resale
06-10
947
2,058,000
2,173
1
Nov 2025
Resale
01-05
517
930,000
1,800
1
Last downloaded: 12 Nov 2026, 12:21 SGT. 19 matching records in the selected period.
Rental Contracts
Latest recorded lease start: Sep 2026.
Lease start month
Bedrooms
Area range (sqft)
Monthly rent (S$)
Jan 2026
1
500-600
3,200
Dec 2025
1
500-600
3,350
Dec 2025
1
500-600
3,300
Dec 2025
1
500-600
3,100
Dec 2025
1
500-600
3,300
Nov 2025
1
500-600
3,300
Nov 2025
1
500-600
3,200
Nov 2025
1
500-600
3,400
Last downloaded: 27 Oct 2026, 17:08 SGT. 28 matching records in the selected period.
Source: Urban Redevelopment Authority (URA), accessed through the URA Data Service. Data made available under the Singapore Open Data Licence. Areas are rounded; rental areas are ranges. Records may be revised and do not identify exact units. Multiple transactions in the same month are not ordered by day. These records are historical transactions, not current listings or valuations.