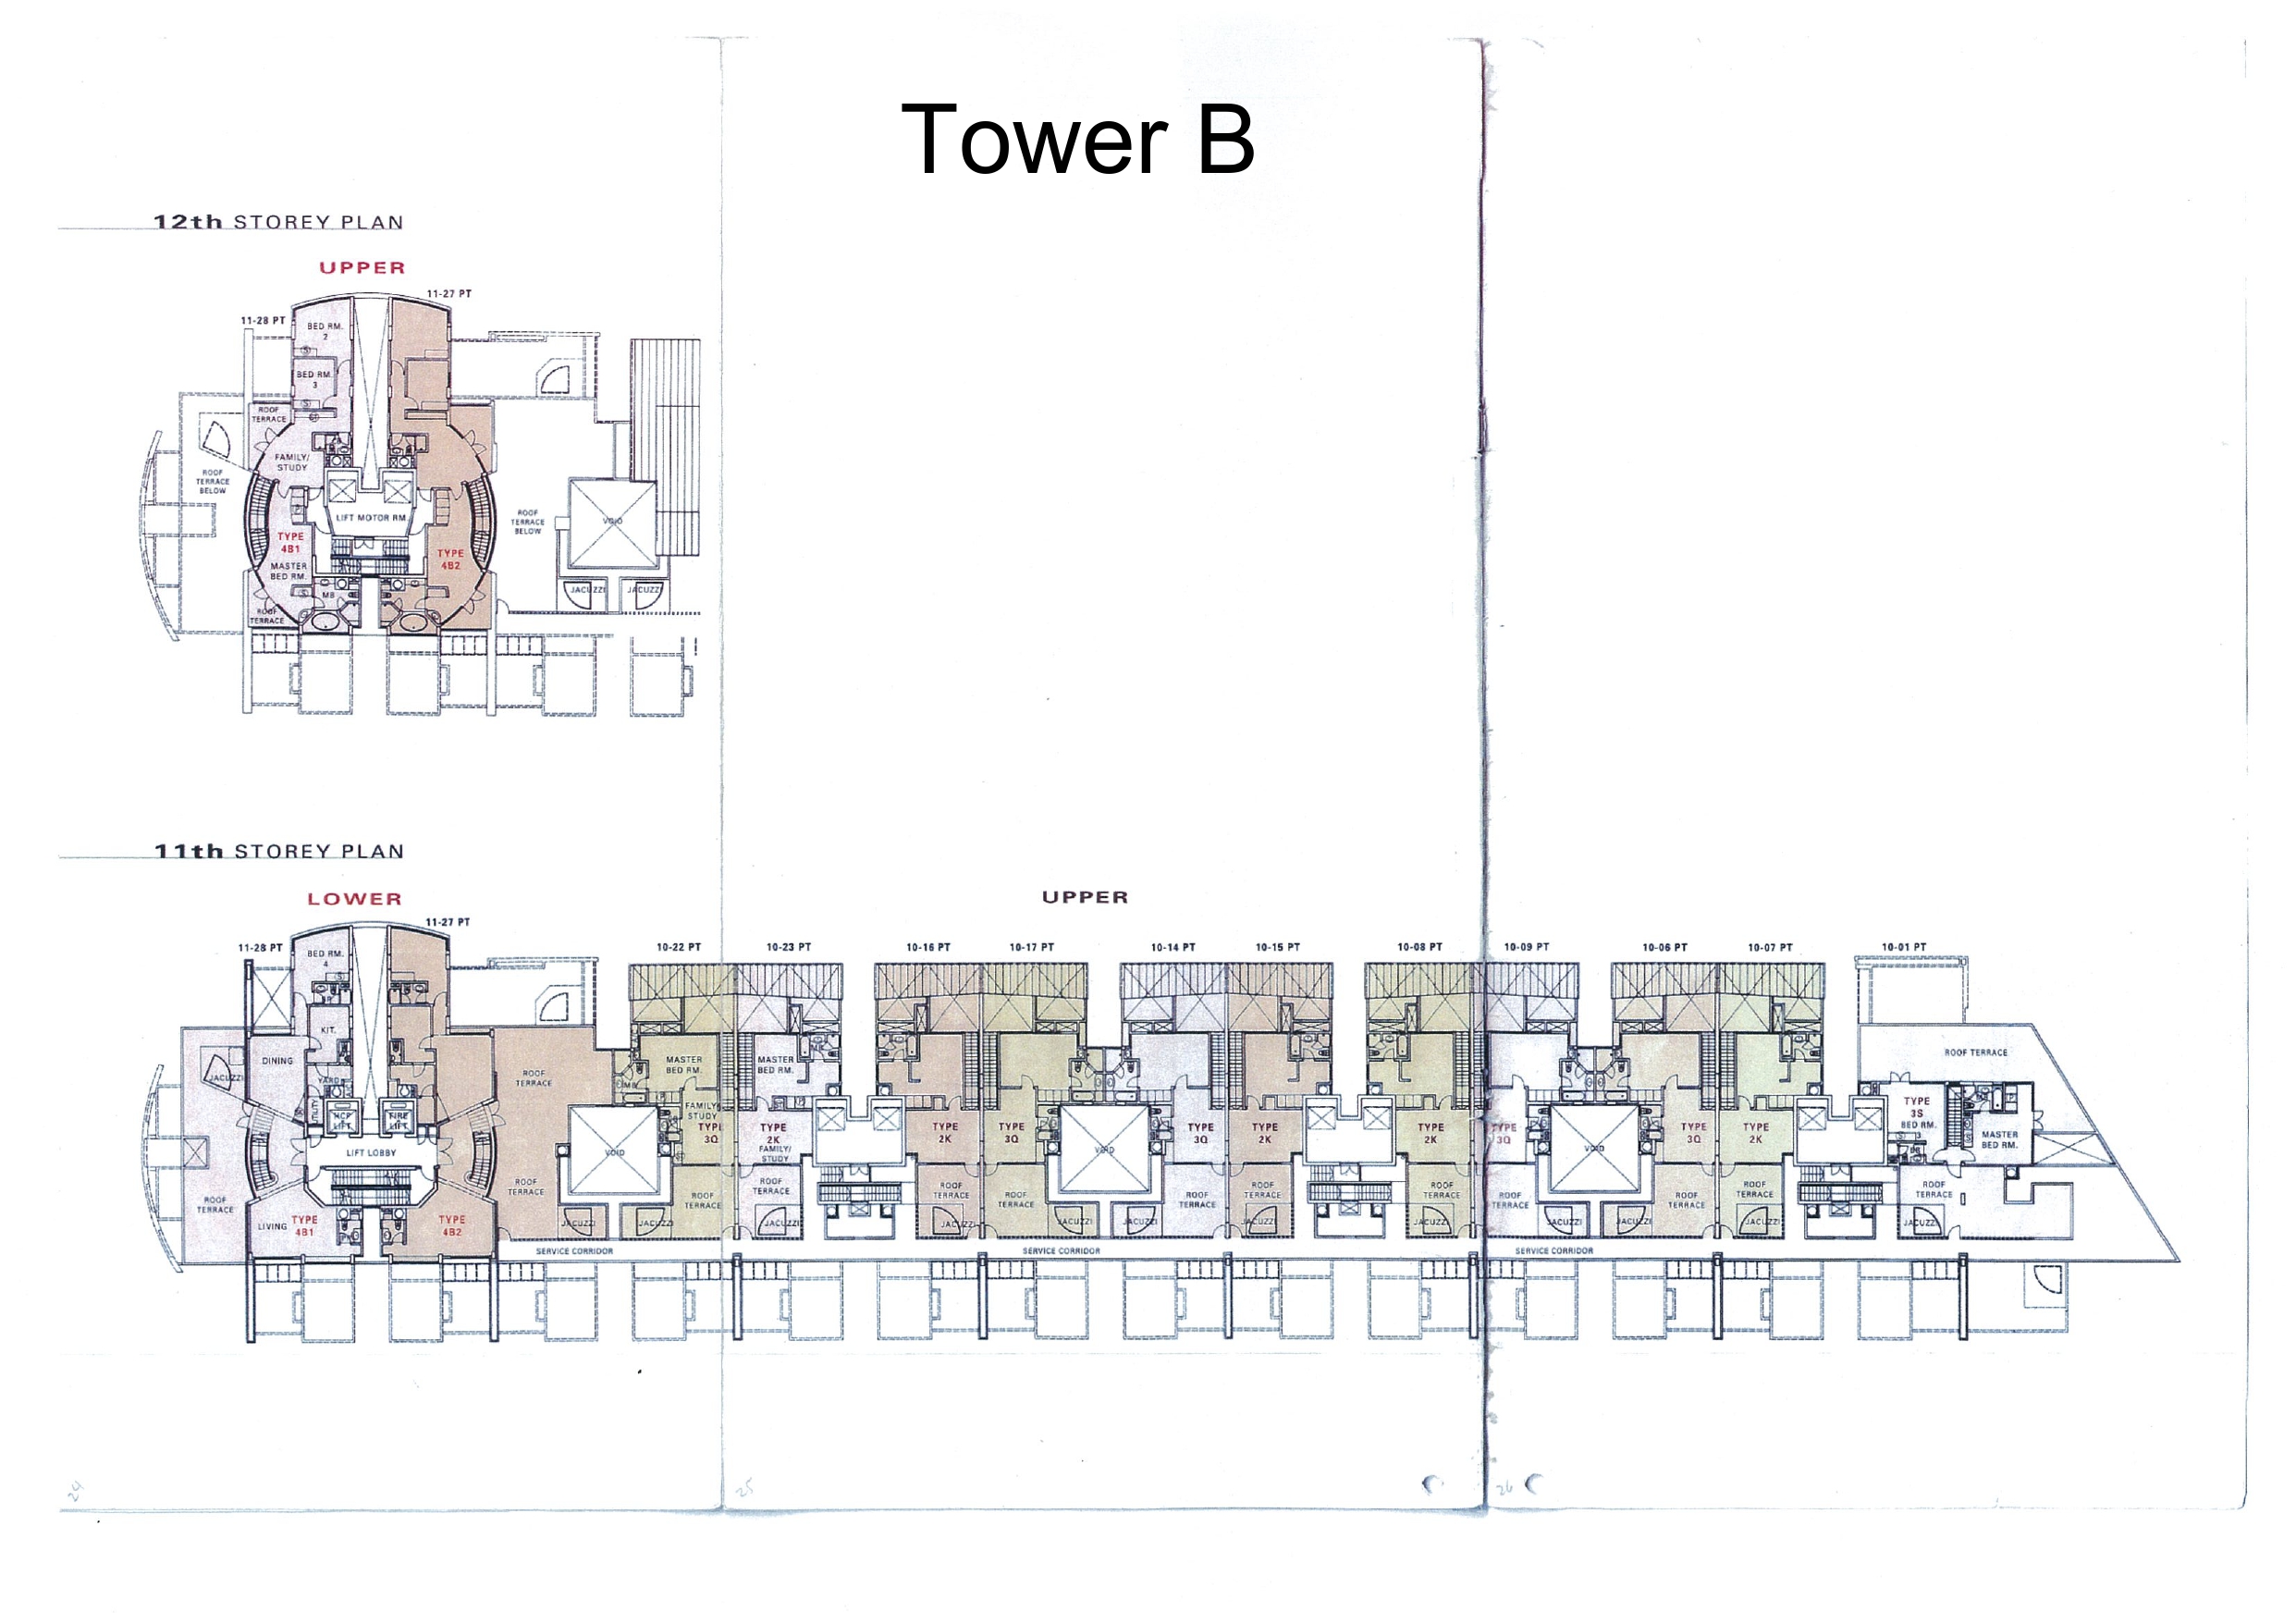
Home In On Spectacular
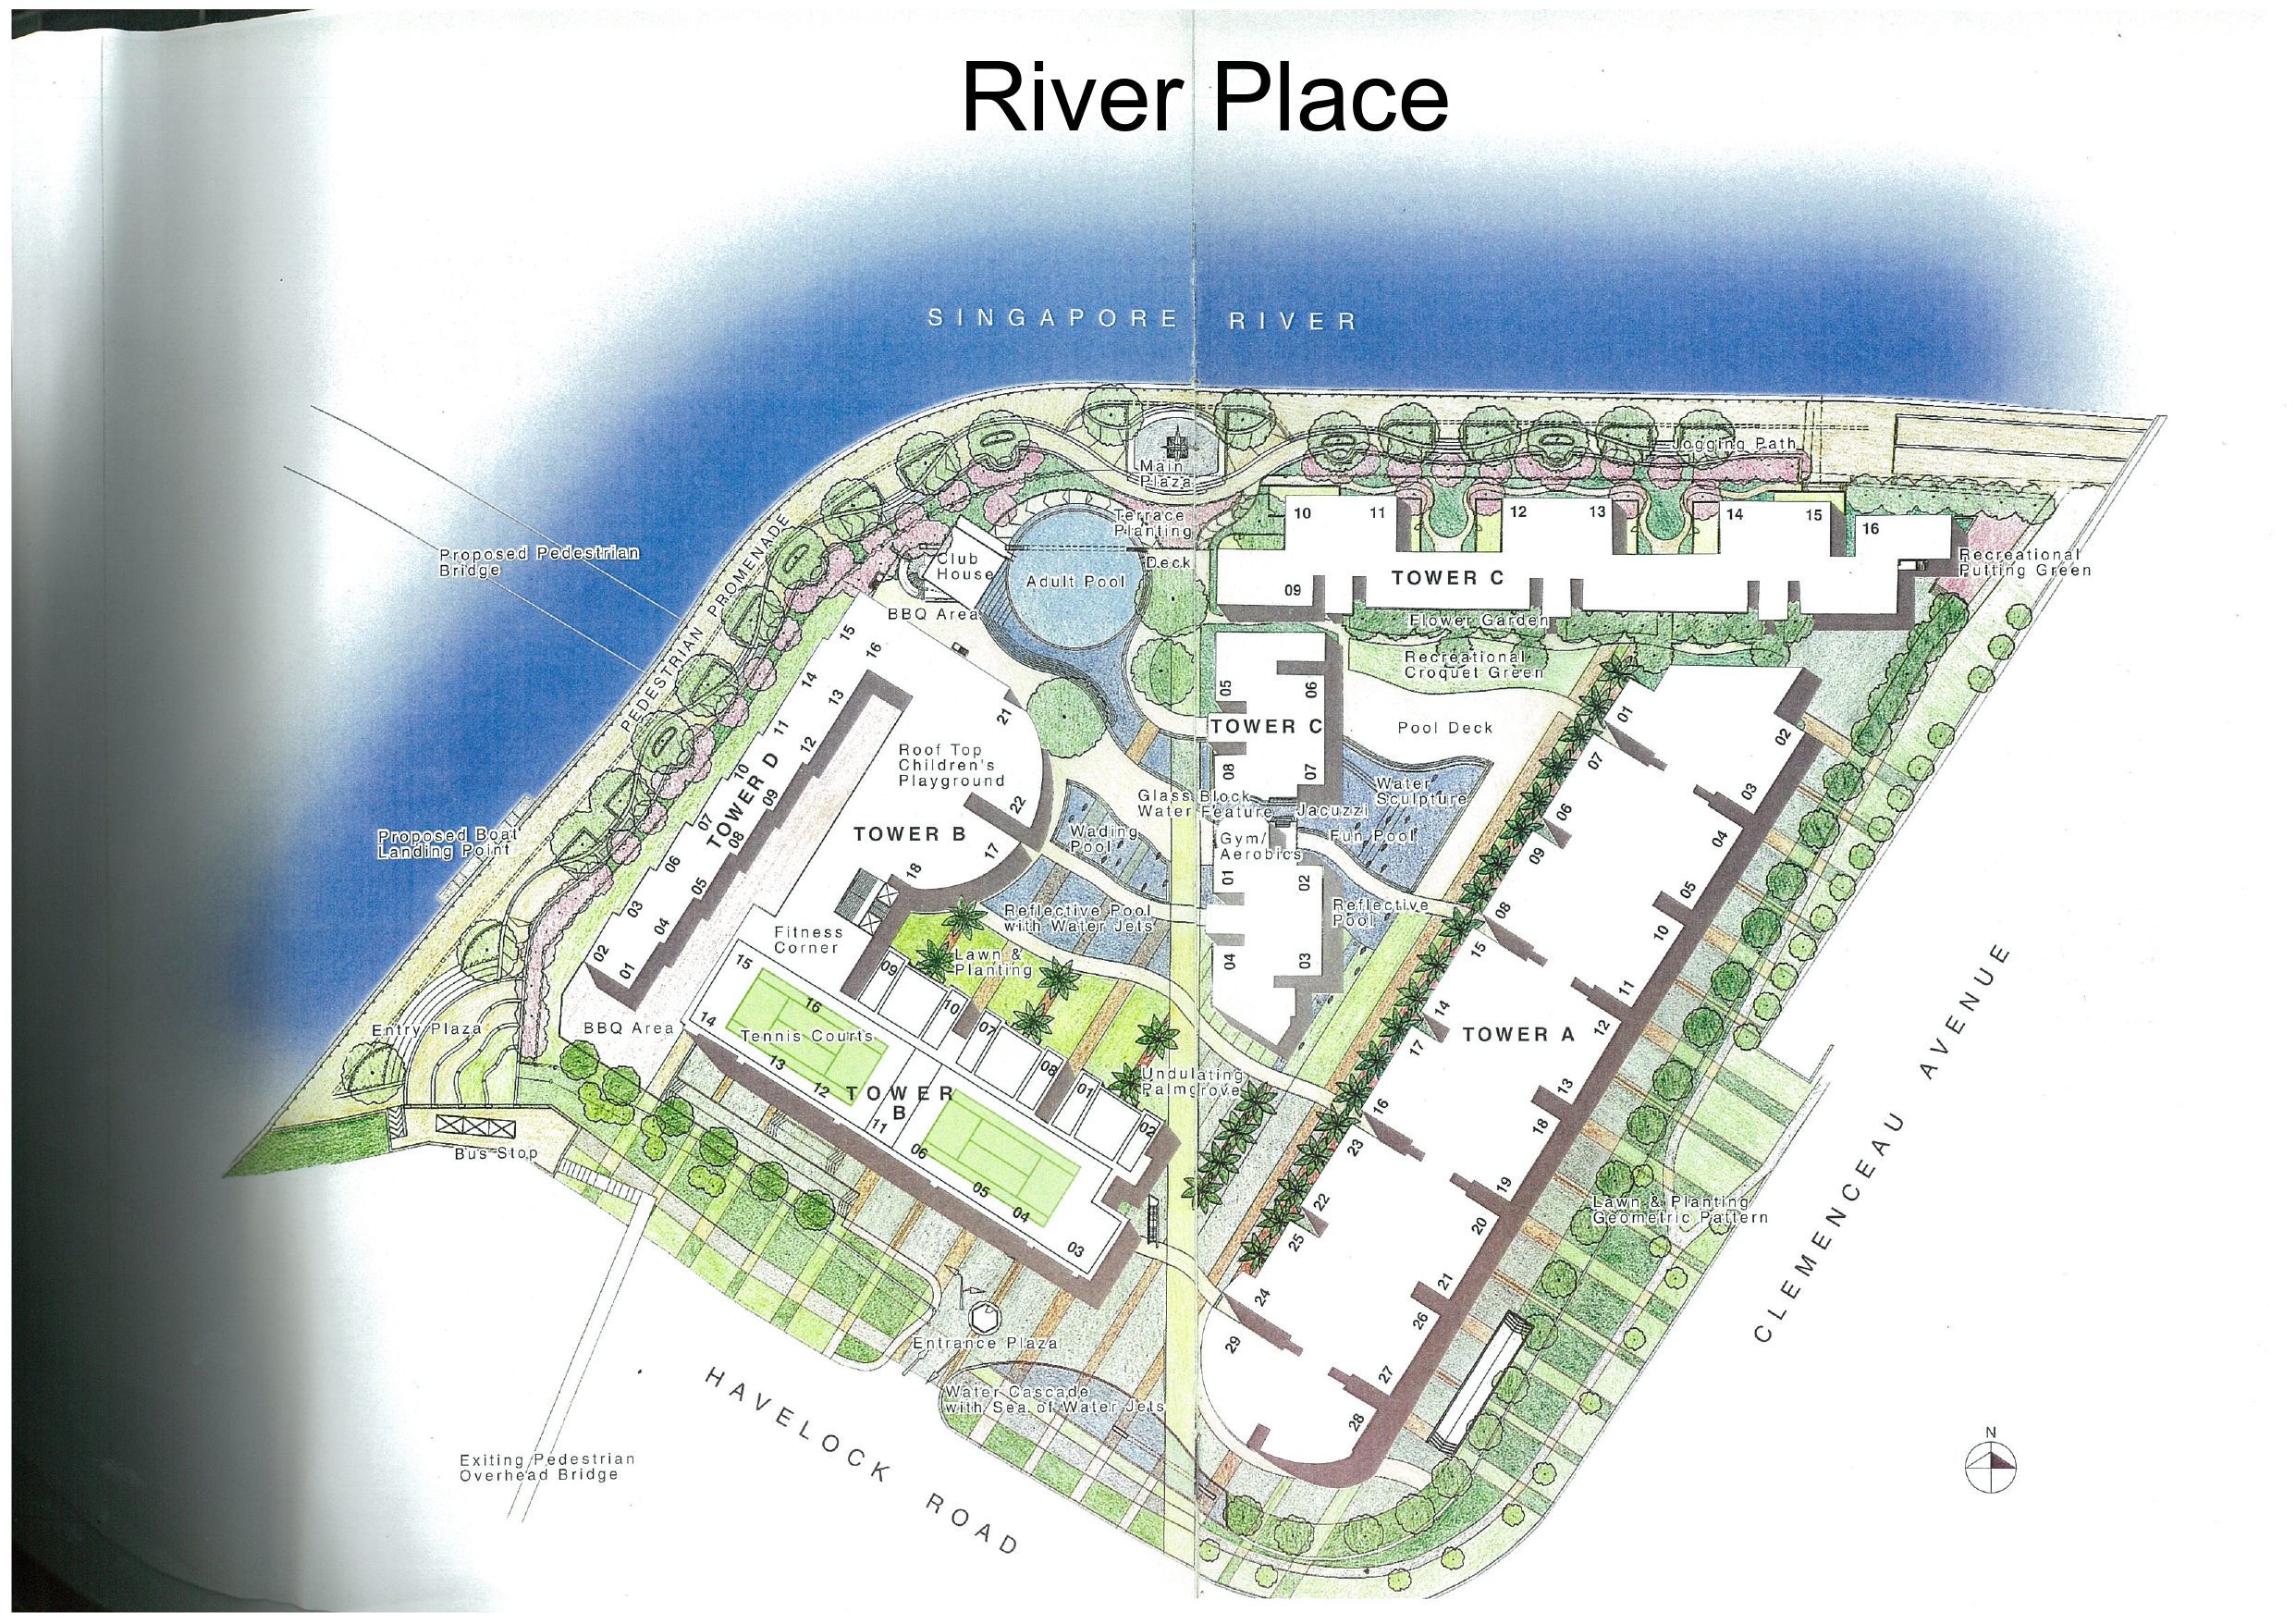
One of the most sought-after lifestyles, riverfront living can only be spectacular. Juxtaposed on the edge of the Centrak Business District, River Place boasts an absolute advantage that is the dream of many. And especially so with the exceptional quality and outstanding value it affords you.
Poised For Greater Success
Designed to indulge in the discerning tastes of the trendy elite, River Place has all the pleasurable trappings of the good life – modern aesthetics flaunting a superb clubhouse, grandiose swimming pools, tennis courts, jacuzzis and barbecue pits amongst a myriad of other amenities.
River Place Location Map
River Place Street View
River Place Resale/Rental Prices
Enquire About This Development
Request the latest pricing and availability, arrange a viewing or get help comparing this development with other projects.
Share your contact details below and we’ll get in touch to discuss your enquiry. No obligation to proceed.
Other Topics That May Interest You
RIVER PLACE Sales and Rental Transactions
Share a link to the applied filters and selected section. Figures update over time.
Property market snapshot
Prices, rents and activity
Nov 2025 – Oct 2026
Size and bedroom options show recorded transactions in the selected period; they do not describe every unit type in the development. The period ends before the current month. Sales filters apply to sales; bedroom selection applies to rentals. The same filters apply to the figures, charts and transaction tables below.
RIVER PLACE · Nov 2025 – Oct 2026 The imported URA data contains 18 sales and 6 rental contracts matching the selected period and filters.
Median single-unit sale price: S$1,845,000, based on 18 sales. Median strata sale price per square foot: S$1,831 / sqft, based on 18 sales. Median monthly rent: S$9,468, based on 6 rental contracts.
Sale type: All sale types. Sales unit size: All unit sizes. Rental bedrooms: 4 bedrooms. Historical transactions describe this sample, not current asking prices, rental listings or a valuation.
Median sale priceS$1,845,00018 single-unit sales · All sale types
Median sale PSFS$1,831 / sqft18 strata sales · All sale types
Median monthly rentS$9,4686 rental contracts
Recorded activity18 sale records6 rental contracts · selected period
The sale cards combine sale types. Choose New Sale, Sub Sale or Resale for a focused comparison; the size breakdown keeps those types separate.
Sale prices by unit size
Median transaction price; sale types shown separately. Bars share a zero-based scale within this panel. Select a size label to filter sales.
Medians describe the transactions in this view, not a valuation or a change in every home’s value. Middle 50% is the 25th–75th percentile, shown only with at least five observations; smaller groups are flagged. Minima and maxima are available in the breakdown tables. Percentiles use linear interpolation.
Price and PSF statistics include only sales explicitly recorded as one unit. Bulk sales and records with an unknown unit count remain in the detailed table when All unit sizes is selected. PSF uses unrounded strata area; size bands use rounded square feet. A size band does not identify bedrooms, penthouses, layout or unit condition.
Rental bedrooms are as reported; missing or non-numeric values are Not stated. Rental sizes are ranges. Rents and sales are separate samples: no project yield or exact rental PSF is inferred.
Discuss this property
Get a price or rental assessment
Request an assessment for your home or discuss rental potential based on comparable transactions.
RIVER PLACE · Nov 2025 – Oct 2026 · All sale types · All unit sizes · 4 bedrooms
Your enquiry will include the property, page URL and transaction filters shown above. Yield-calculator amounts are excluded.
Test your assumptions
Rental yield calculator
Enter a purchase price and monthly rent for the same home. Results update as you type. Your assumptions stay in this page while you change transaction filters; they are not submitted or saved.
Rental reference in the selected view: median S$9,468 / month from 6 contracts. These contracts may cover different-sized homes. Check the bedroom breakdown and records before choosing your rent assumption.
Optional vacancy and running expenses
Blank expense fields count as zero. Enter annual costs for the full year; they are not reduced during vacancy.
Enter purchase price and monthly rent to calculate.
Annual income after entered expenses = monthly rent × (12 − vacant months) − monthly maintenance × 12 − annual property tax − other annual running costs. Yield after entered expenses divides that income by purchase price.
Results use your assumptions and are indicative, before financing and personal income tax. The denominator excludes stamp duties, legal fees, renovation, furnishing and other acquisition costs. Include recurring insurance, repairs and letting costs in other running costs where relevant. No appreciation, mortgage repayment or return on equity is calculated. Historical rental contracts do not guarantee future rent or occupancy.
History and activity
How transactions changed over time
Monthly · Nov 2025 – Oct 2026
The active filters also apply here. Value axes start at zero and adjust to the selected records; check their labels when comparing views. Each point shows a period median; the bars below count recorded sales or rental contracts. Different sale types and rental bedroom counts have separate series. These changes can reflect the mix of homes transacted, rather than appreciation of an individual home.
Sale PSF history
Median S$/sqft for single-unit strata sales, by sale type.
Resale
On a narrow screen, swipe the chart horizontally. Tap a point/bar or use the period controls for exact figures.
Sep 2026
1 sale records in this period.
Resale: S$1,635 / sqft · 1 sale · limited sample
Exact history and activity table
Period
Resale median PSF
Resale sales
Sale records
Nov 2025
S$1,899
3 (limited)
3
Dec 2025
—
0
0
Jan 2026
S$1,727
2 (limited)
2
Feb 2026
S$1,813
2 (limited)
2
Mar 2026
S$1,858
1 (limited)
1
Apr 2026
S$1,819
2 (limited)
2
May 2026
S$1,657
1 (limited)
1
Jun 2026
S$1,990
1 (limited)
1
Jul 2026
S$1,893
2 (limited)
2
Aug 2026
S$1,839
3 (limited)
3
Sep 2026
S$1,635
1 (limited)
1
Oct 2026
—
0
0
Monthly rent history
Median monthly rent in S$, by reported bedroom count.
4 bedrooms
On a narrow screen, swipe the chart horizontally. Tap a point/bar or use the period controls for exact figures.
Filled points have at least five qualifying observations; hollow points have fewer than five. Lines join only adjacent filled points. Gaps are not estimated or filled with zeros. For five-year views, edge quarters marked * may contain fewer than three selected months. Sale activity bars include all selected sale records; PSF points use only qualifying single-unit strata sales.
Individual sale comparison
Sale price versus unit size
Nov 2025 – Oct 2026 · 18 qualifying sale records. The period, sale-type and unit-size filters above apply. Bedroom filters affect rentals only
Each plotted position represents one or more sales at that size and price. Tap a marker or select a record below for its contract month, floor range and PSF. Markers with a number contain multiple records; none are discarded.
Resale
Both axes start at zero and adjust to the selected sales. All qualifying sales, including extreme values, remain shown. Swipe horizontally on a narrow screen. Identical positions are grouped without moving the data points. Nearby markers can overlap; the selector and table retain every eligible record.
0 selected records excluded from this plot: only explicitly single-unit strata sales with positive numeric prices and areas qualify. Size positions and PSF use unrounded area; displayed sizes are rounded. Record numbers refer to this view and are not unit identifiers. No fitted price or valuation is inferred.
Sales Transactions
Contract month
Type of sale
Floor range
Area (sqft)
Sale price (S$)
Price (S$/sqft)
Units in transaction
Mar 2026
Resale
06-10
969
1,800,000
1,858
1
Feb 2026
Resale
06-10
850
1,550,000
1,823
1
Feb 2026
Resale
06-10
743
1,338,800
1,803
1
Jan 2026
Resale
01-05
969
1,680,000
1,734
1
Jan 2026
Resale
01-05
872
1,500,000
1,720
1
Nov 2025
Resale
06-10
797
1,504,000
1,888
1
Nov 2025
Resale
06-10
1,281
2,560,000
1,999
1
Nov 2025
Resale
01-05
1,216
2,310,000
1,899
1
Last downloaded: 12 Nov 2026, 12:22 SGT. 18 matching records in the selected period.
Rental Contracts
Latest recorded lease start: Sep 2026.
Lease start month
Bedrooms
Area range (sqft)
Monthly rent (S$)
Sep 2026
4
2000-2100
9,000
Sep 2026
4
2100-2200
7,800
Sep 2026
4
>3000
10,800
Aug 2026
4
2100-2200
10,000
Jul 2026
4
>3000
9,686
Dec 2025
4
2000-2100
9,250
Last downloaded: 27 Oct 2026, 17:09 SGT. 6 matching records in the selected period.
Source: Urban Redevelopment Authority (URA), accessed through the URA Data Service. Data made available under the Singapore Open Data Licence. Areas are rounded; rental areas are ranges. Records may be revised and do not identify exact units. Multiple transactions in the same month are not ordered by day. These records are historical transactions, not current listings or valuations.
River Place: Location & Nearby
Explore nearby transport, selected schools, supermarkets, food centres, recreation, shopping destinations and selected hotels. Select a place to see its location or an estimated walking or public transport route.
Nearby amenities at a glance
Selected places near River Place. Distances are approximate straight-line distances from the nearest reviewed development gate to saved map points, not walking distances or times. Gate access restrictions may apply. School points represent campuses; distances are not for Primary 1 admission.
MRT / LRT
FORT CANNING MRT STATION(DT20)— 596 mRIVER VALLEY ROAD
CHINATOWN MRT STATION(NE4)— 633 mNEW BRIDGE ROAD
CHINATOWN MRT STATION(DT19)— 633 mUPPER CROSS STREET
Show 1 more mrt / lrt
CLARKE QUAY MRT STATION(NE5)— 673 mEU TONG SEN STREET
Bus stops
BLK 2(06161)— 70 mHAVELOCK RD
RIVER PL CONDO(06169)— 70 mHAVELOCK RD
BLK 8(06039)— 252 mCHIN SWEE RD
Show 3 more bus stops
AFT SOLOMON ST(06189)— 337 mHAVELOCK RD
AFT SAIBOO ST(06151)— 358 mHAVELOCK RD
AFT UNITY ST(13211)— 372 mMOHD SULTAN RD
Schools
RIVER VALLEY PRIMARY SCHOOL— 776 m2 RIVER VALLEY GREEN
SCHOOL OF THE ARTS, SINGAPORE— 1.45 km1 Zubir Said Drive 05 01
CANTONMENT PRIMARY SCHOOL— 1.52 km1 Cantonment Close
Show 4 more schools
ZHANGDE PRIMARY SCHOOL— 1.71 km51 Jalan Membina
ST. MARGARET'S SCHOOL (PRIMARY)— 1.75 km136 Sophia Road
ALEXANDRA PRIMARY SCHOOL— 1.81 km2A Prince Charles Crescent
The Heeren— 1.55 km260 Orchard Road Singapore 238855
Downtown Gallery(Retail & dining)— 1.56 km6A Shenton Way Singapore 068815
Valley Point— 1.56 km491 River Valley Road, Singapore 248371Expected to cease operations on 31 March 2027 for redevelopment. Check current availability before visiting.
CityLink Mall— 1.57 km1 Raffles Link Singapore 039393
International Plaza(Retail & dining)— 1.59 km10 Anson Road Singapore 079903
100AM— 1.61 km100 Tras Street Singapore 079027
Icon Village— 1.61 km12 Gopeng Street Singapore 078877
Ngee Ann City— 1.62 km391 Orchard Road Singapore 238873
Bugis Junction (Part of Bugis Town)— 1.99 km200 Victoria Street Singapore 188021
The Bencoolen(Retail & dining)— 1.99 km180 Bencoolen Street, Singapore 189646
Use the map below to select gates, review entrance choices and request walking or public transport directions. This overview lists the saved selections; map filters do not change it. Sources and data dates are listed below.
Selected schools; this list is not exhaustive. Gate-to-point distances are for orientation, not P1 admission.
Calculating walking route…
List distances are straight-line estimates. Walking routes start at the named gate and exclude walking within the development or indoors. Mapped shop and food-centre points may differ from entrances. Park walks use a map reference point unless an entrance has been reviewed. Check access restrictions, opening hours and temporary closures; routes do not confirm sheltered or step-free access. Public transport estimates include buses and MRT/LRT, use current services and include walking and waiting; they are not live bus arrivals. Walking sections are dashed, bus routes are blue and rail routes are purple. School distances are not for P1 admission. Lists and source coverage may be incomplete.
Selected schools use reviewed campus and entrance records shared across this website. Source: MOE via data.gov.sg and OneMap, supplemented where needed by official school website addresses. School entrances may be for school users or authorised visitors only; check the selected entrance’s access note.
Primary 1 admission: Gate-to-point and walking distances do not determine the official home-school distance category or admission eligibility. Check your exact residential address using OneMap School Query and MOE’s guidance.
Food & Markets: NEA via data.gov.sg; retrieved 12 Nov 2026. See the source for its coverage period. Singapore Open Data Licence. Covers NEA-listed centres and selected supplementary food locations, not all restaurants, coffee shops or private food courts.
Parks & Recreation: NParks park points and SportSG facilities, via data.gov.sg, retrieved 12 Nov 2026. Singapore Open Data Licence. Park reference points are not entrances or nearest boundaries; large parks may have nearer entrances outside the source-point search. SportSG coverage excludes Dual Use Scheme venues. Selected attractions and museums use separately sourced official addresses, matched by exact postal code through OneMap; these are not part of the NParks / SportSG datasets. Check operator access, fees, bookings, current opening status and source coverage dates.