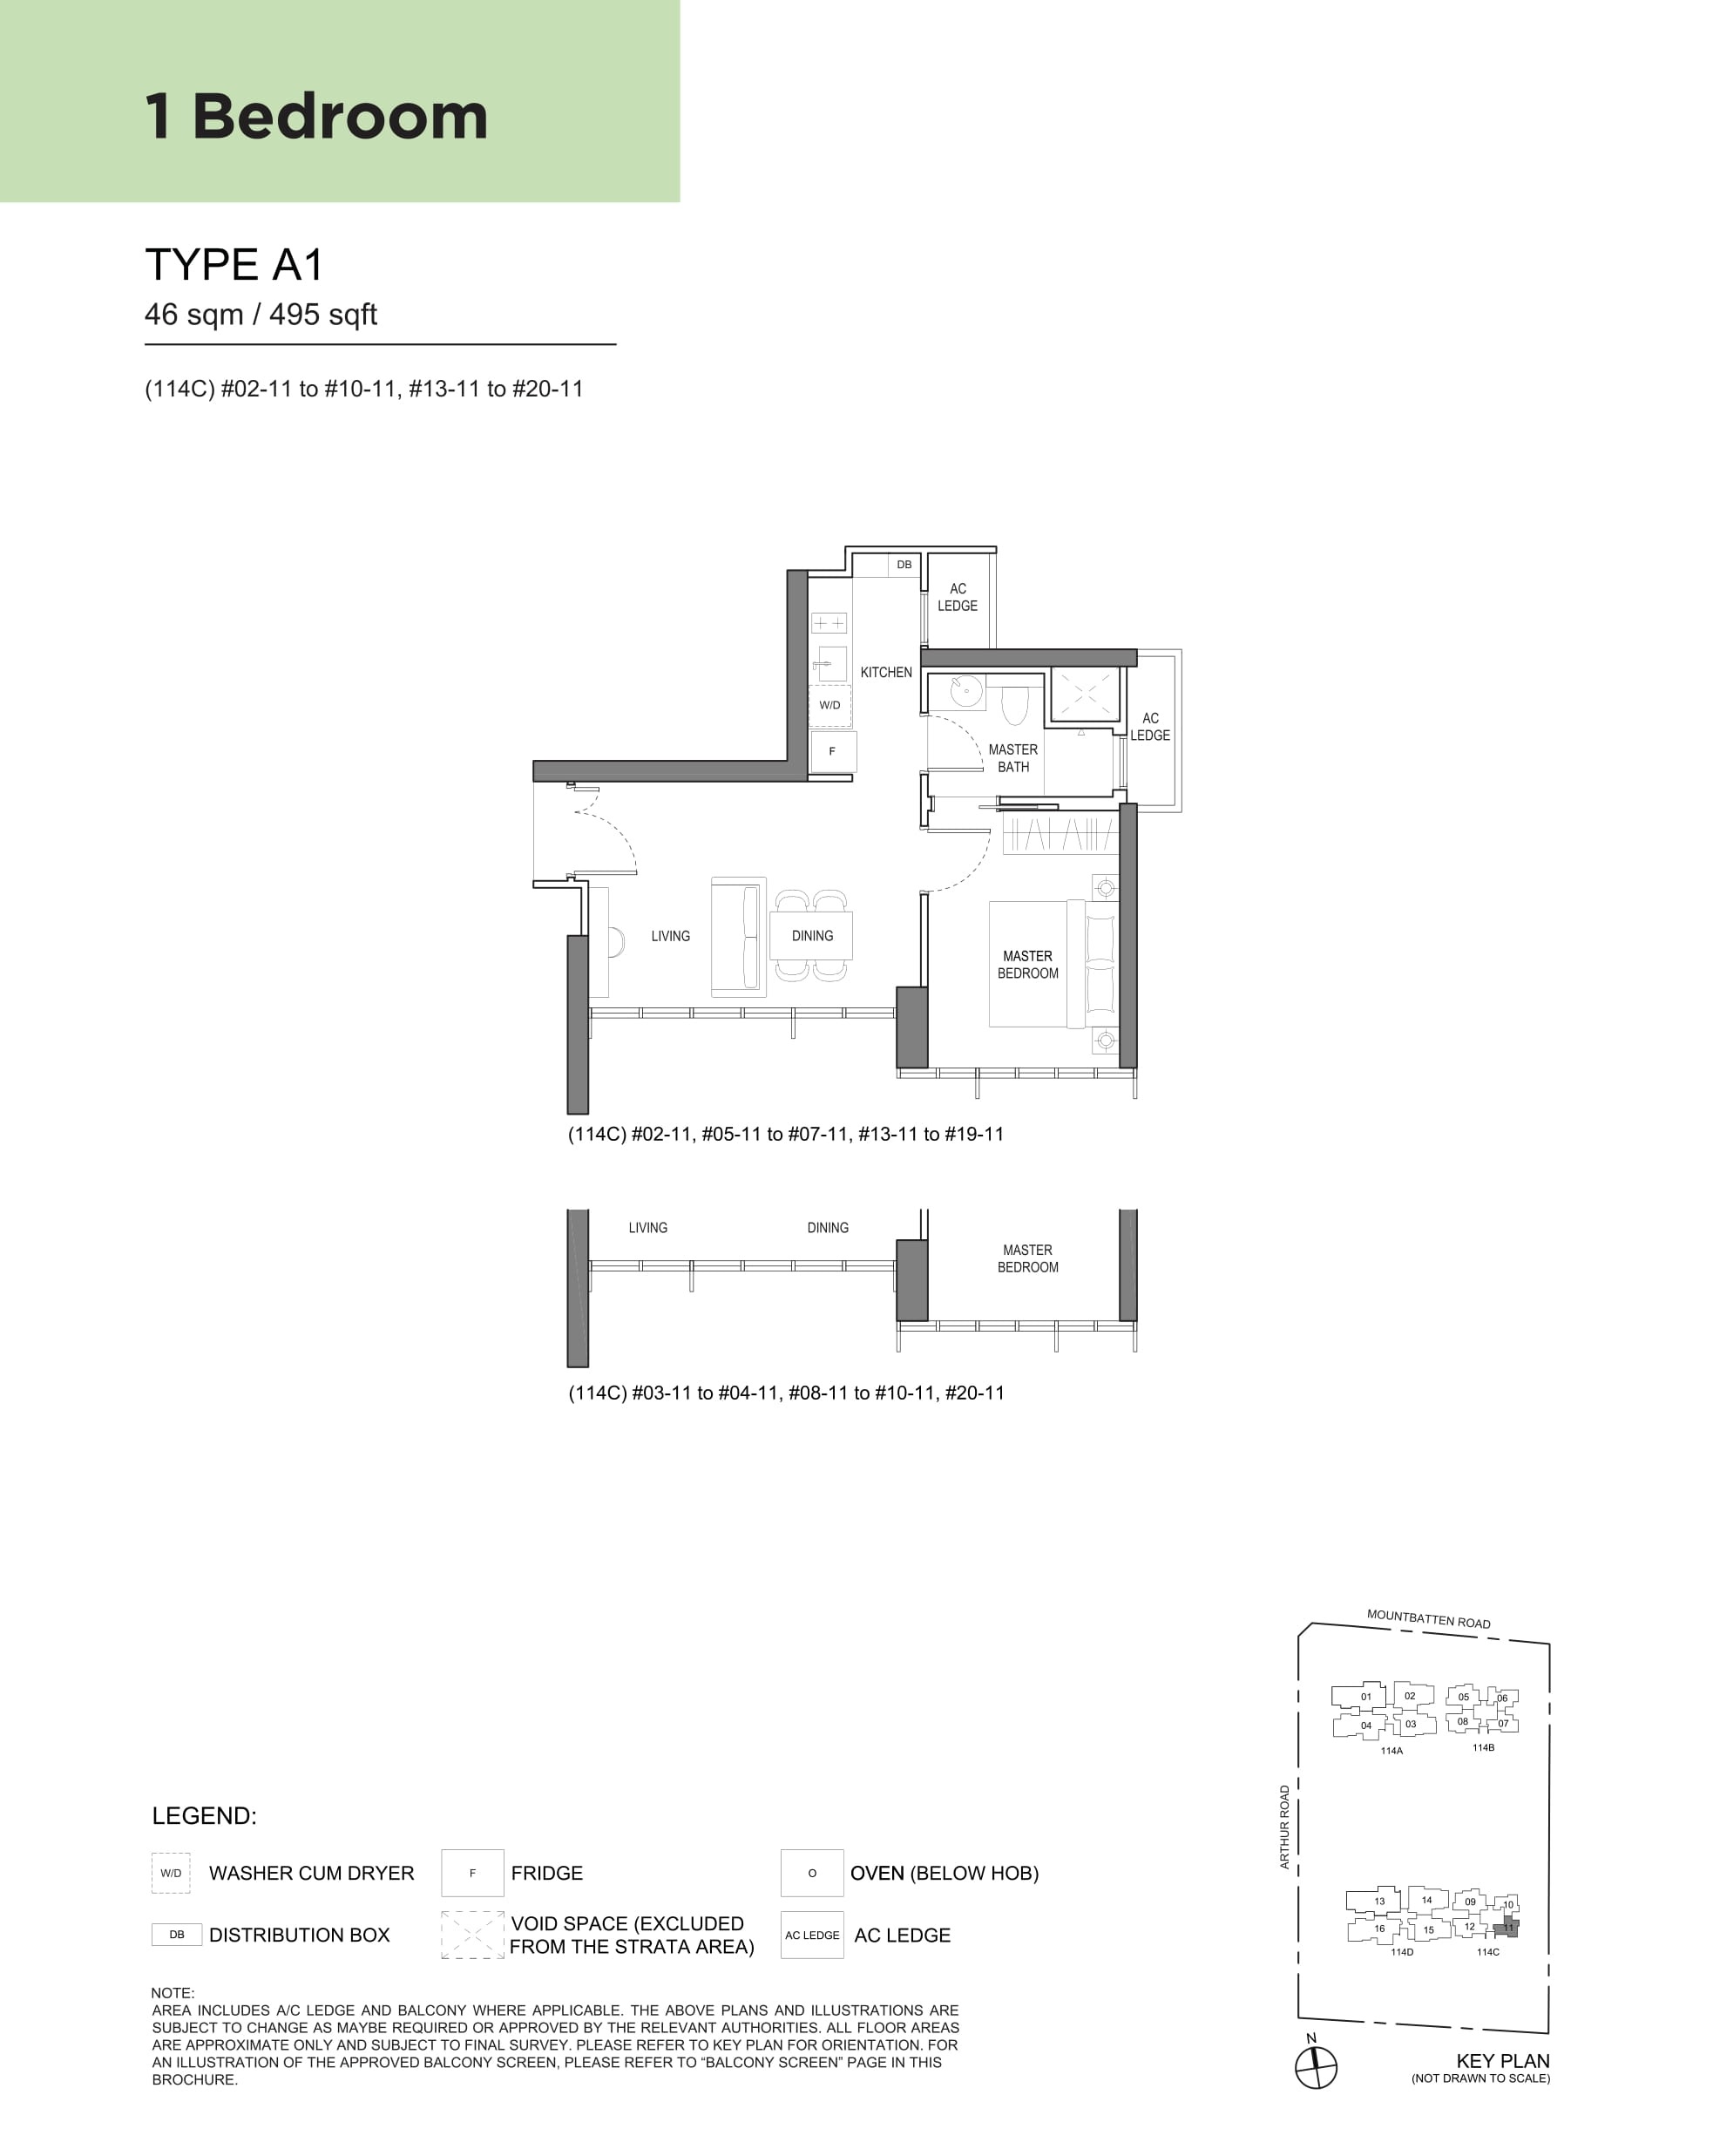
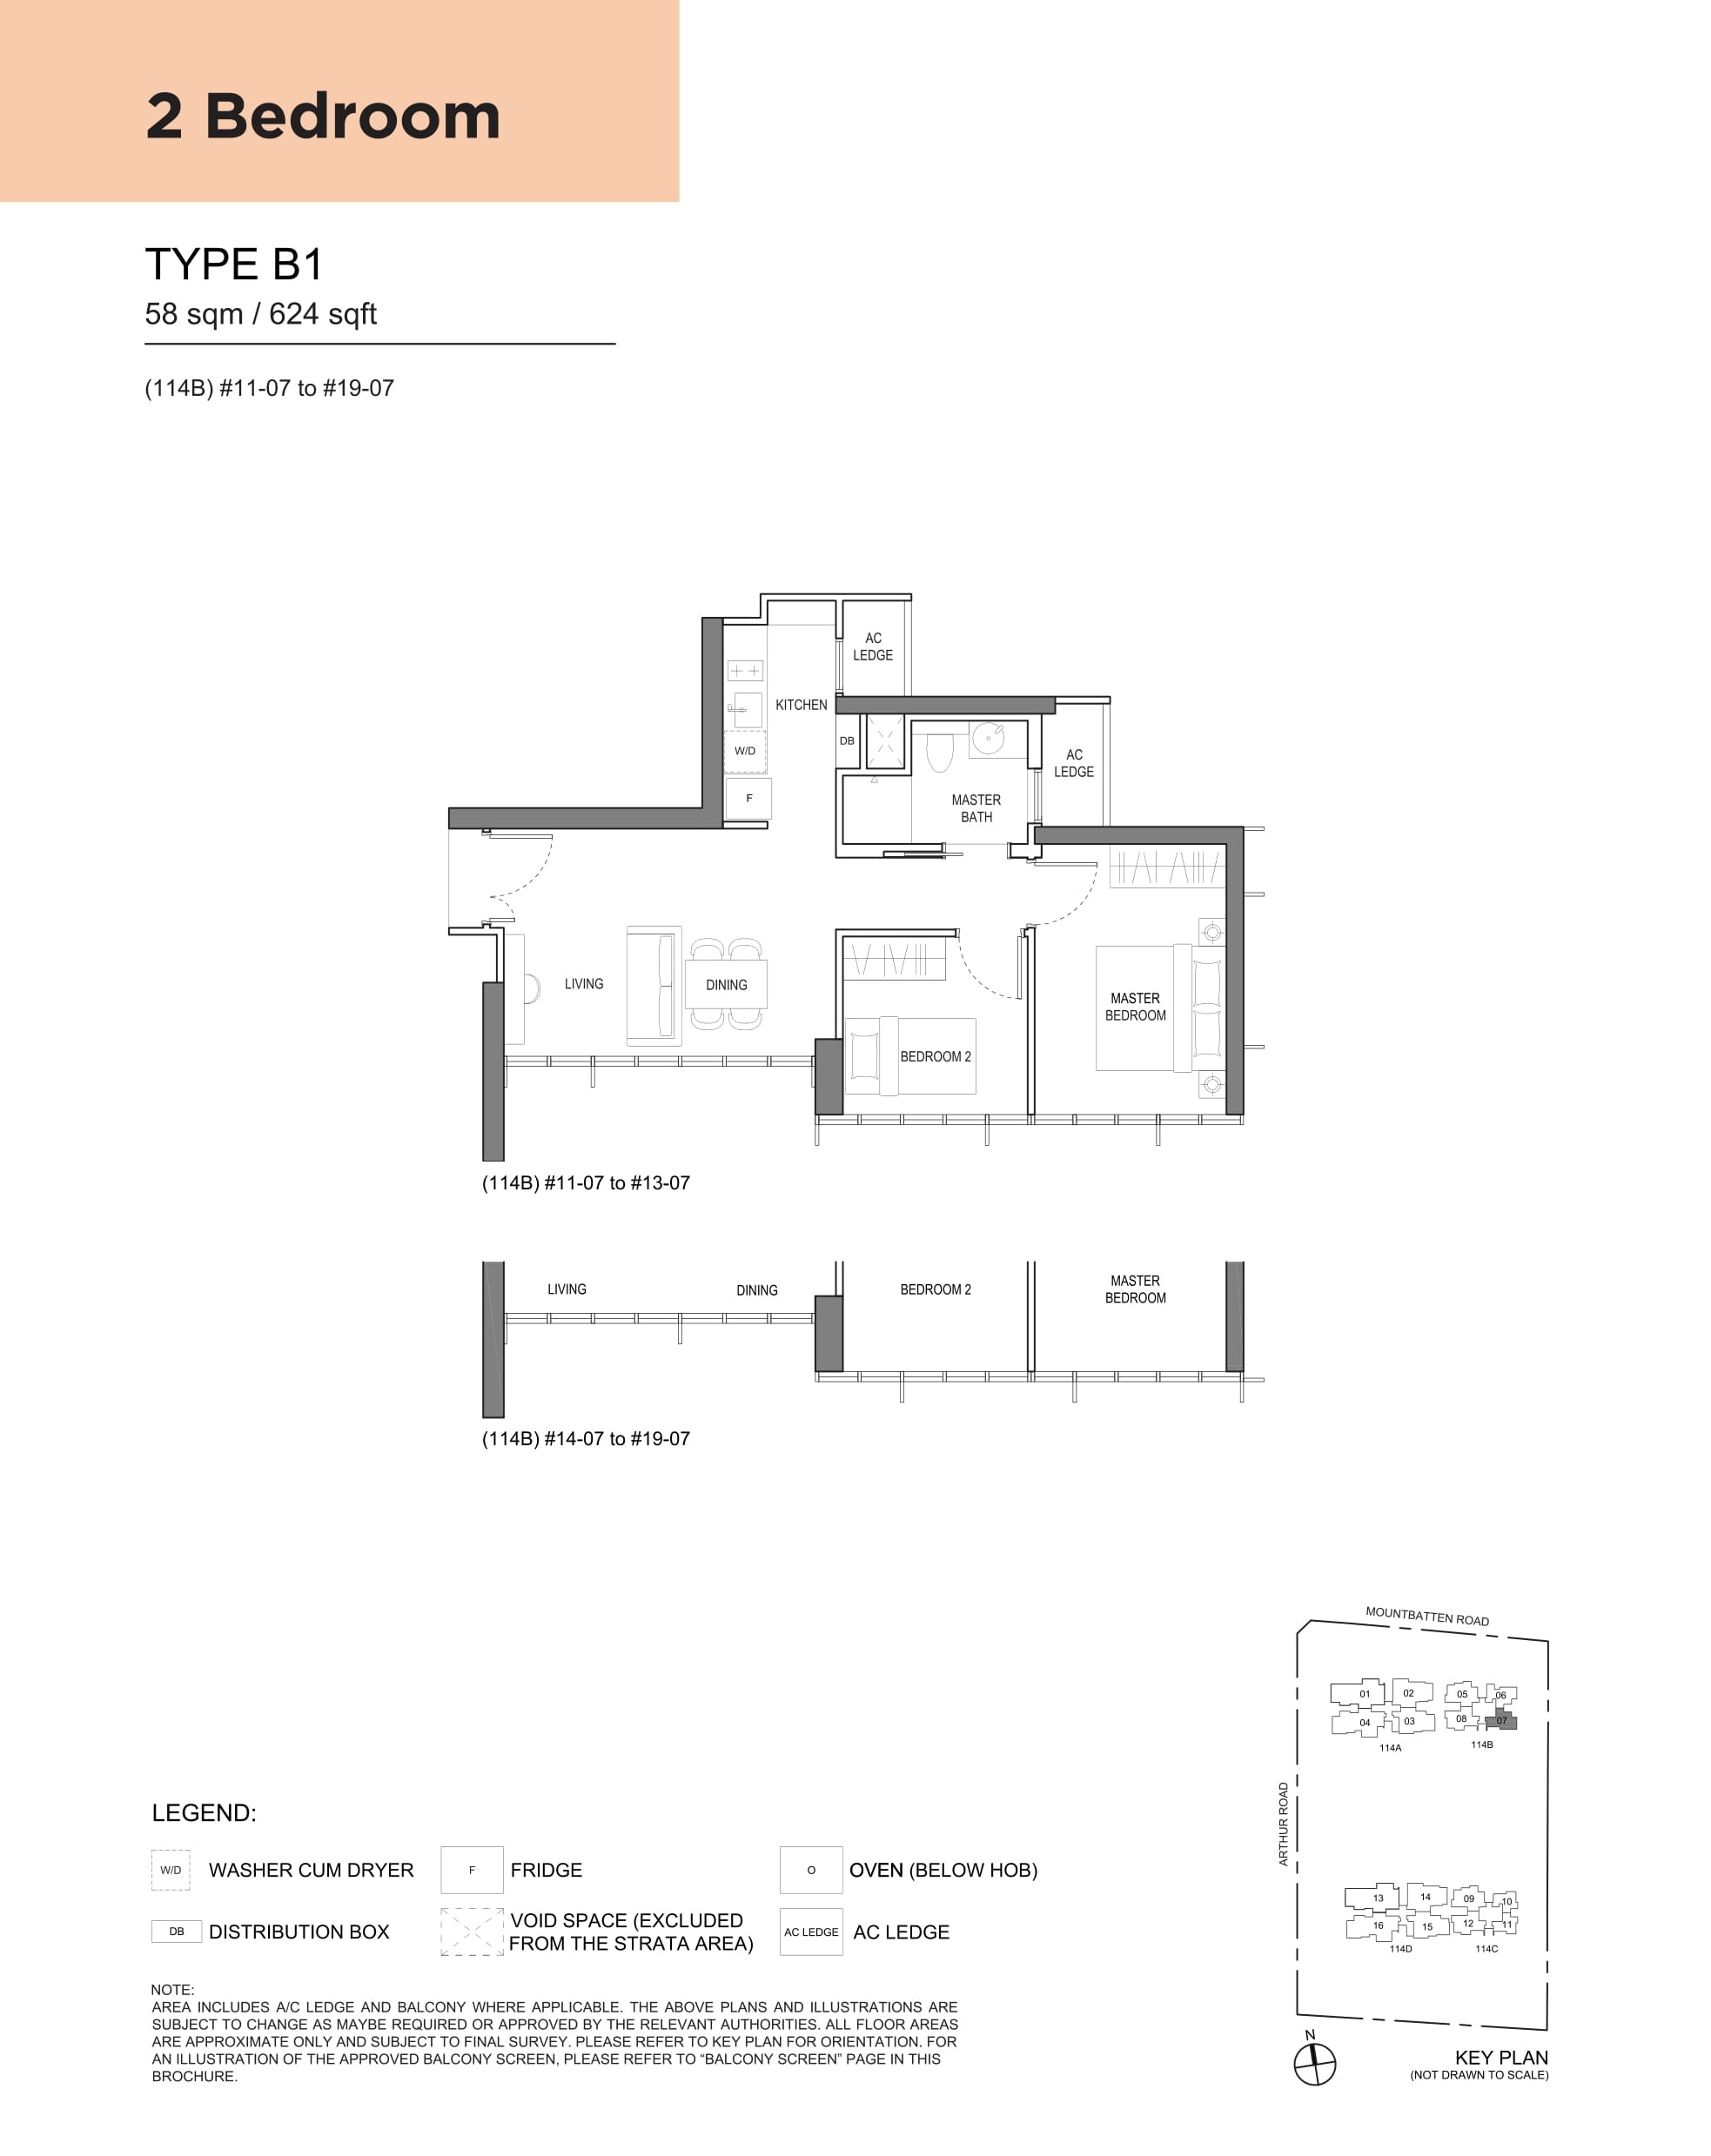
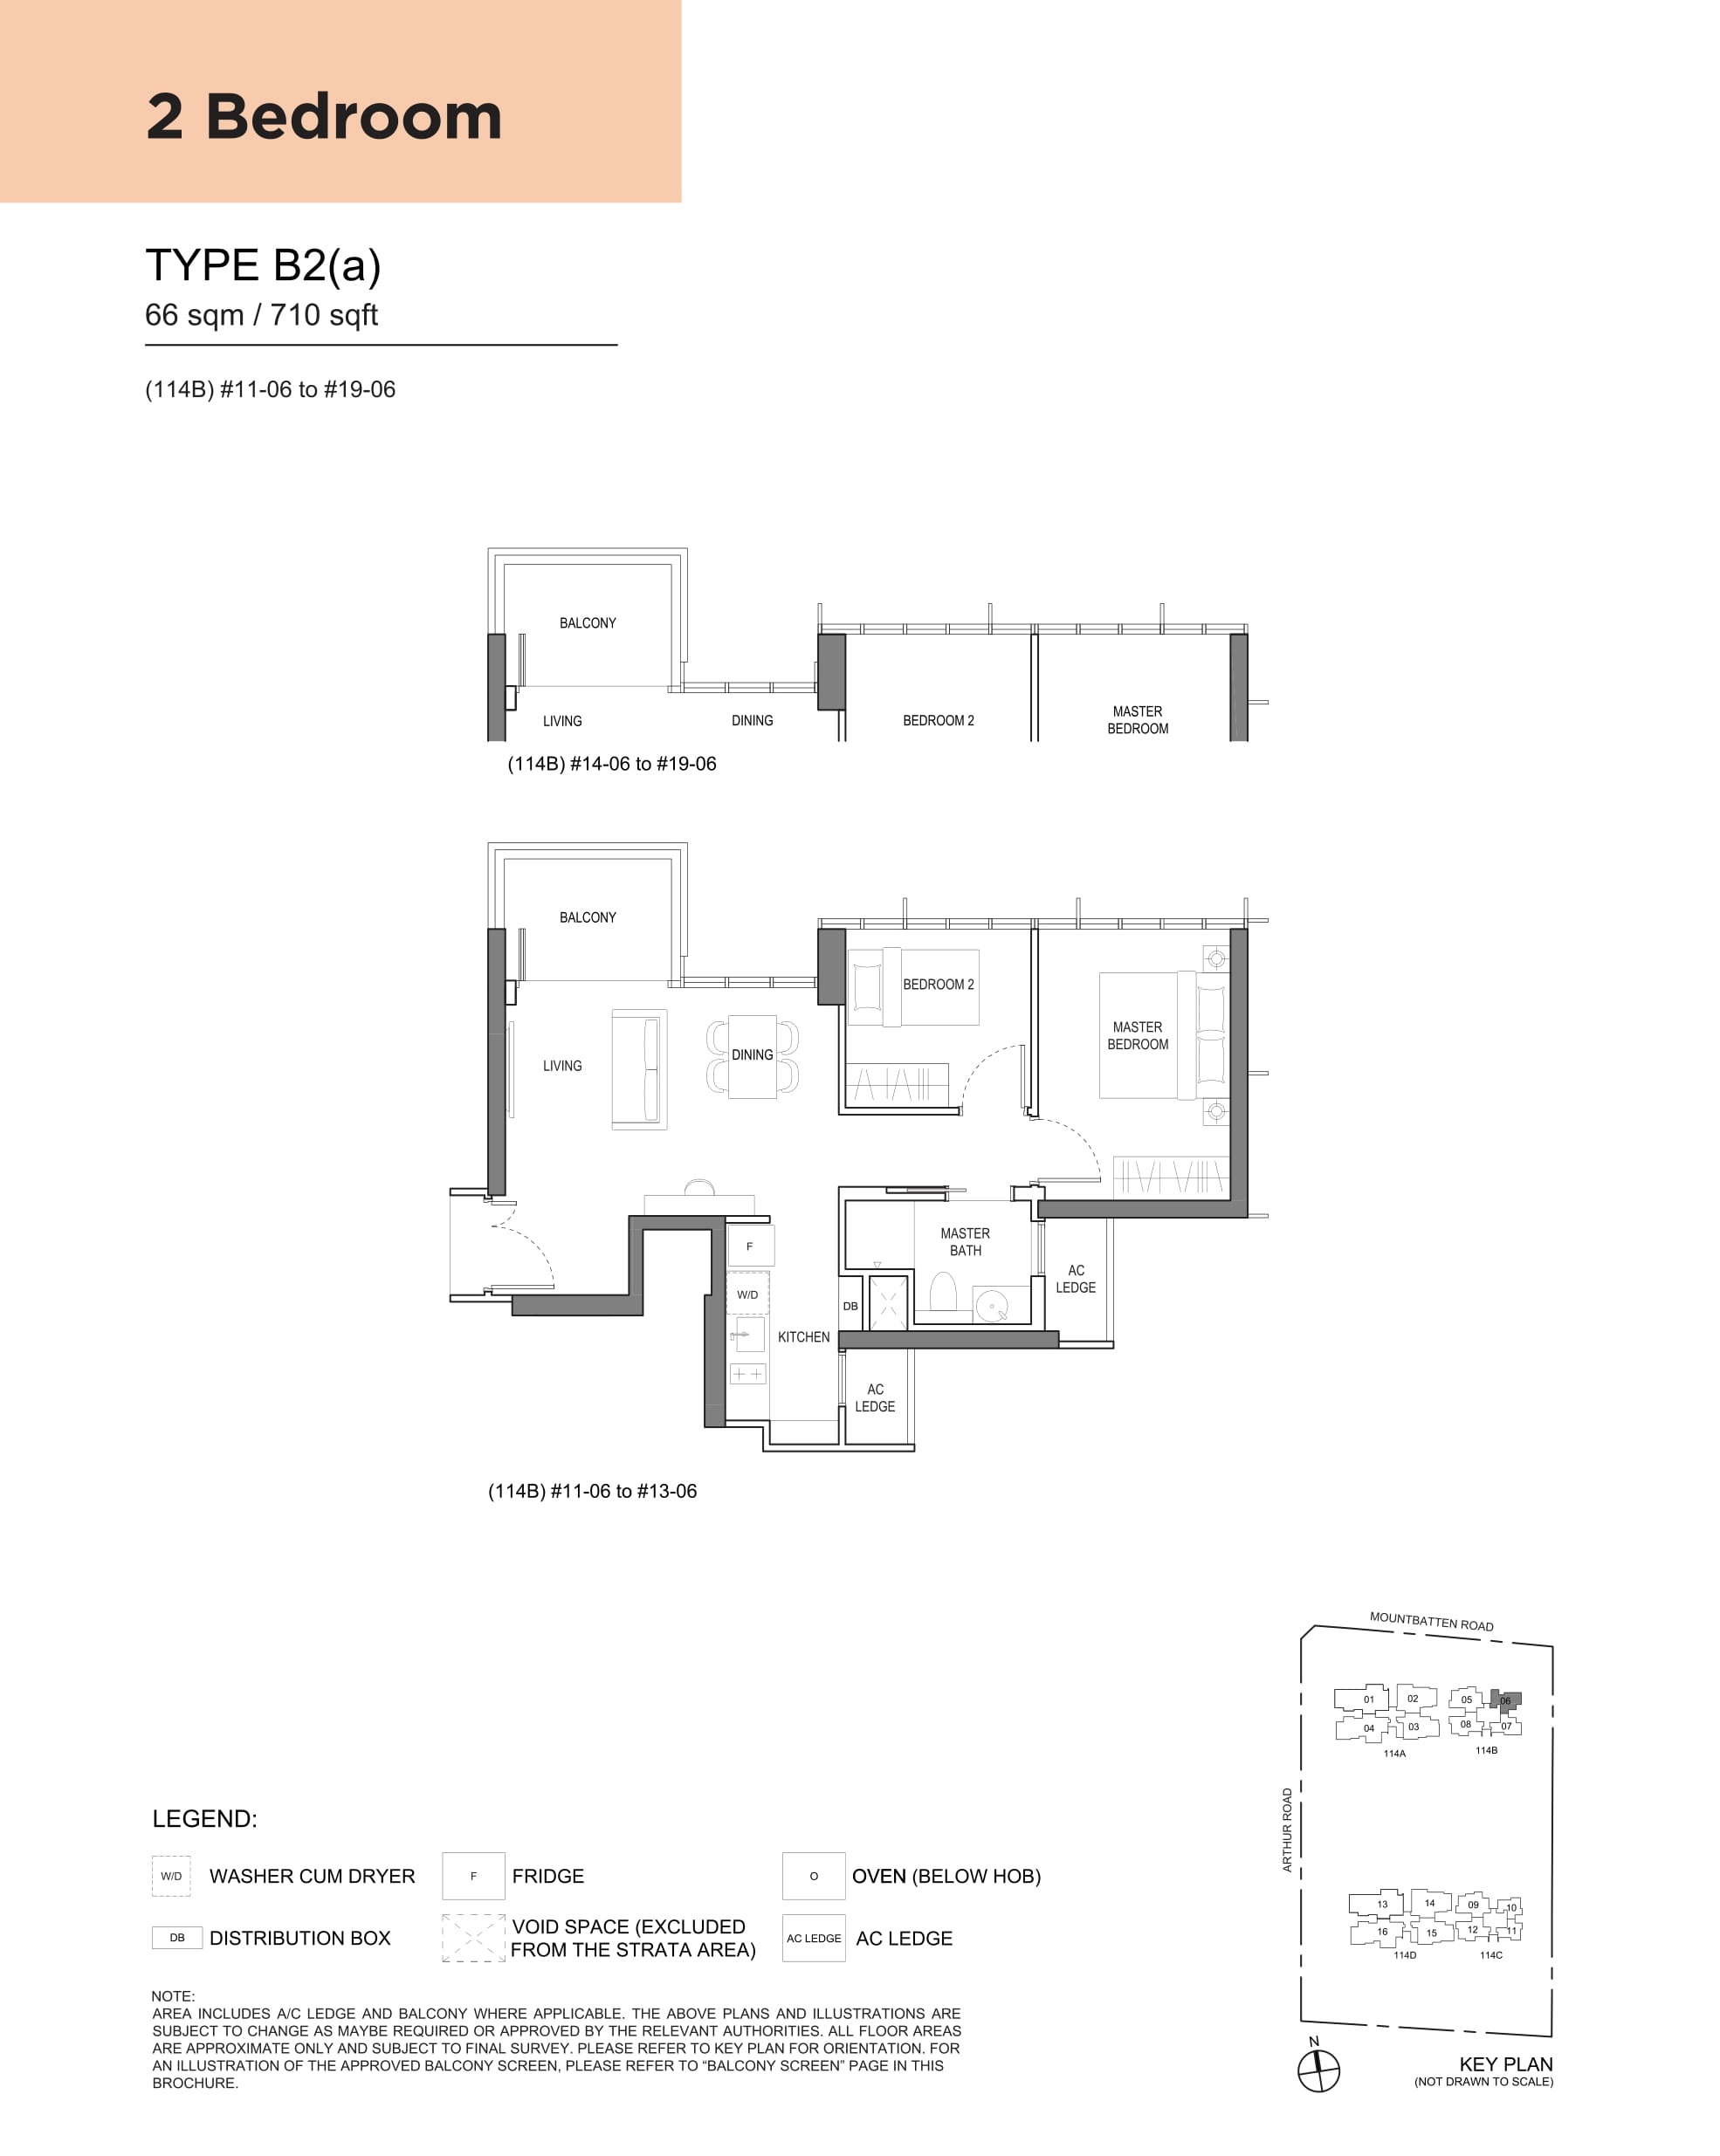
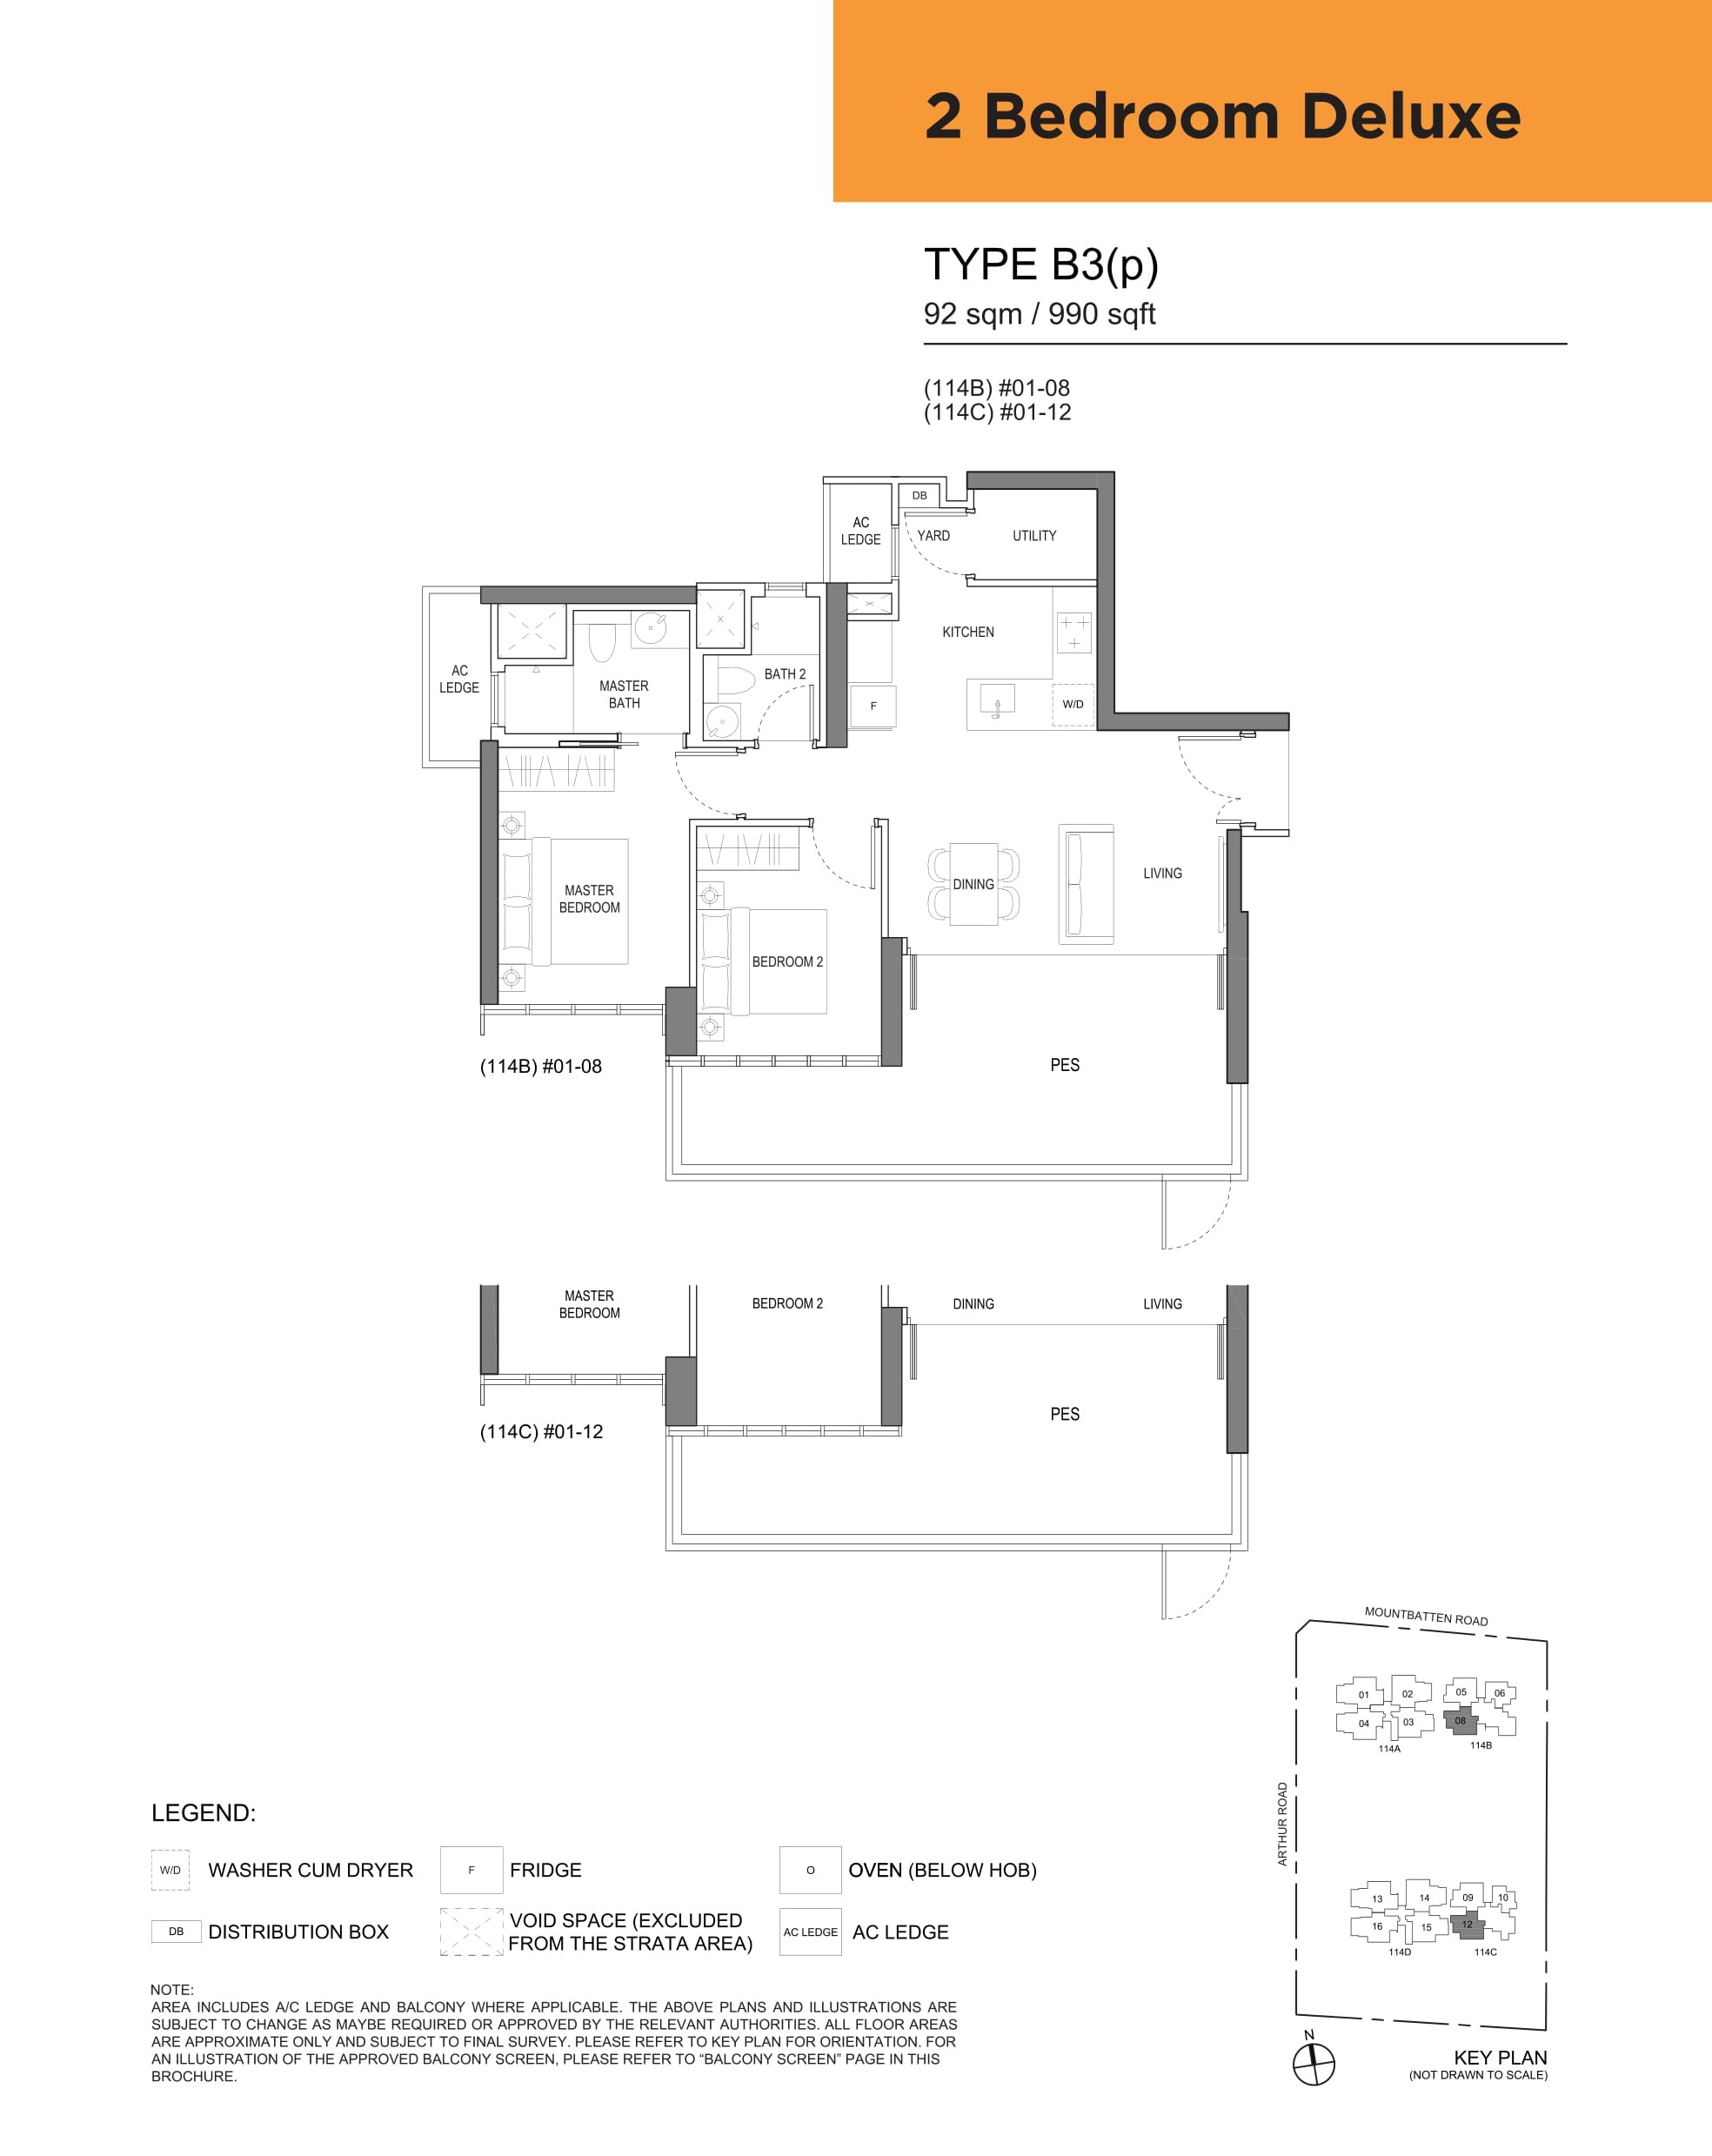
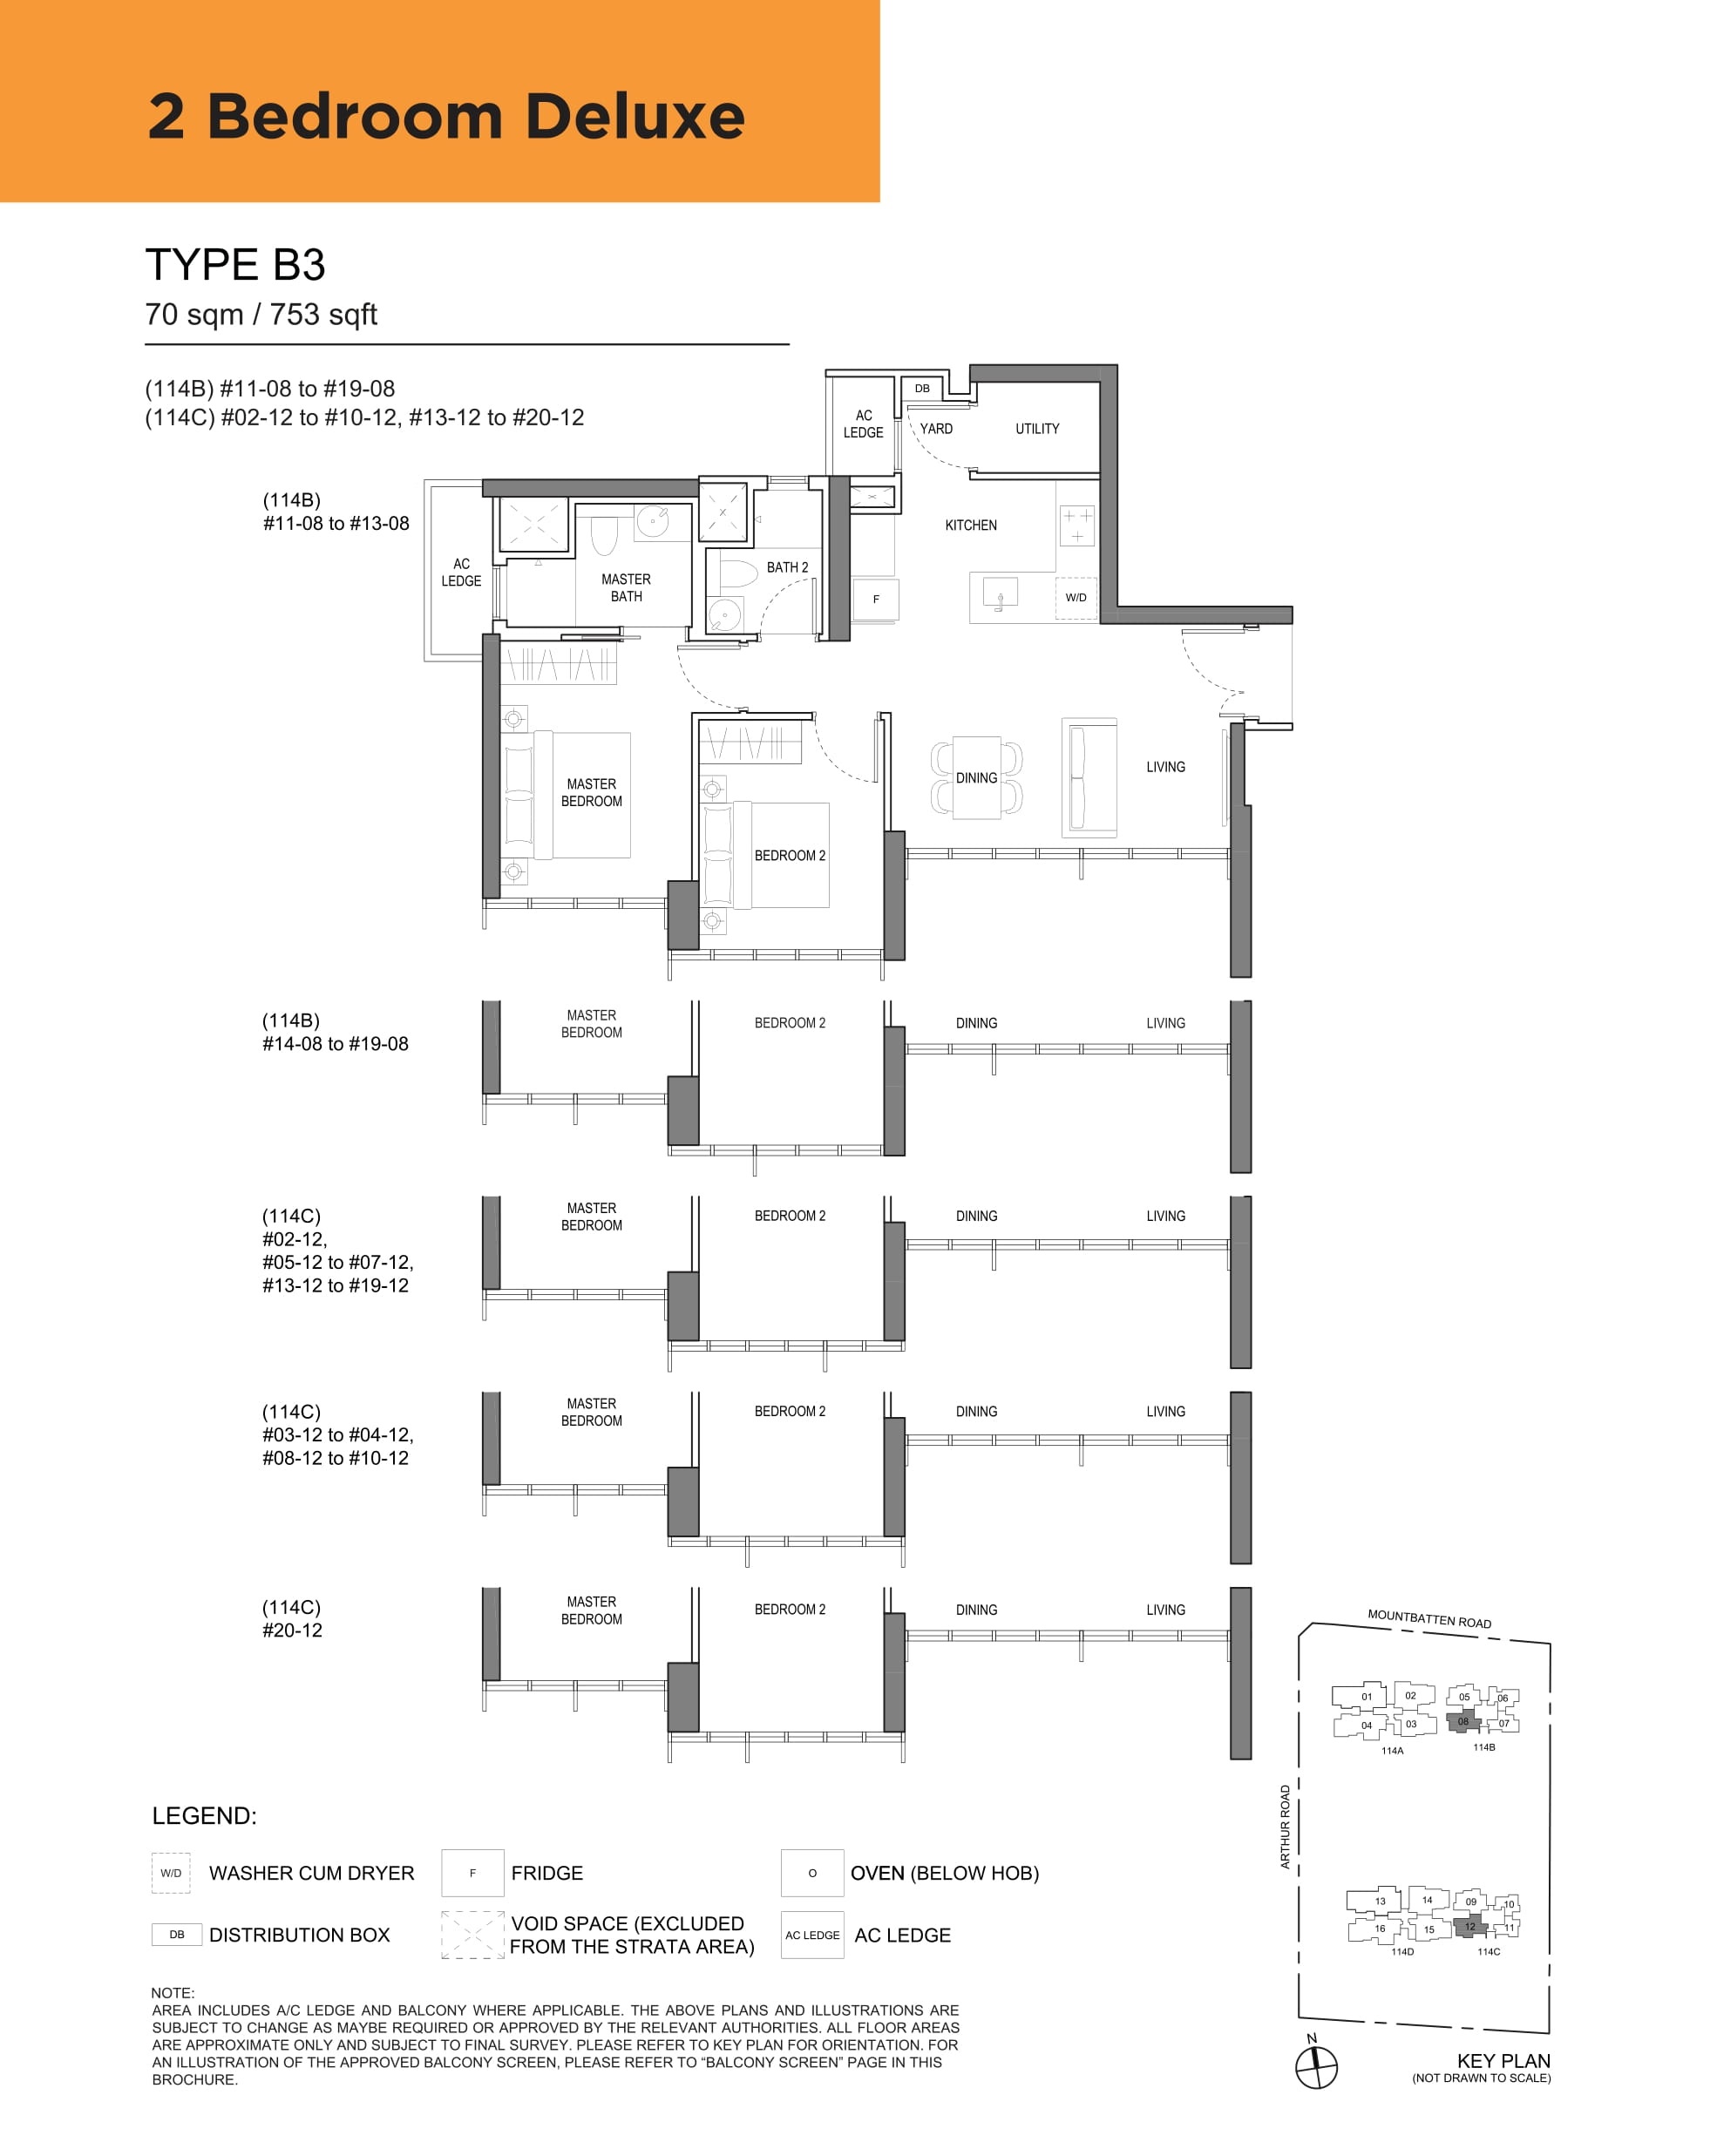
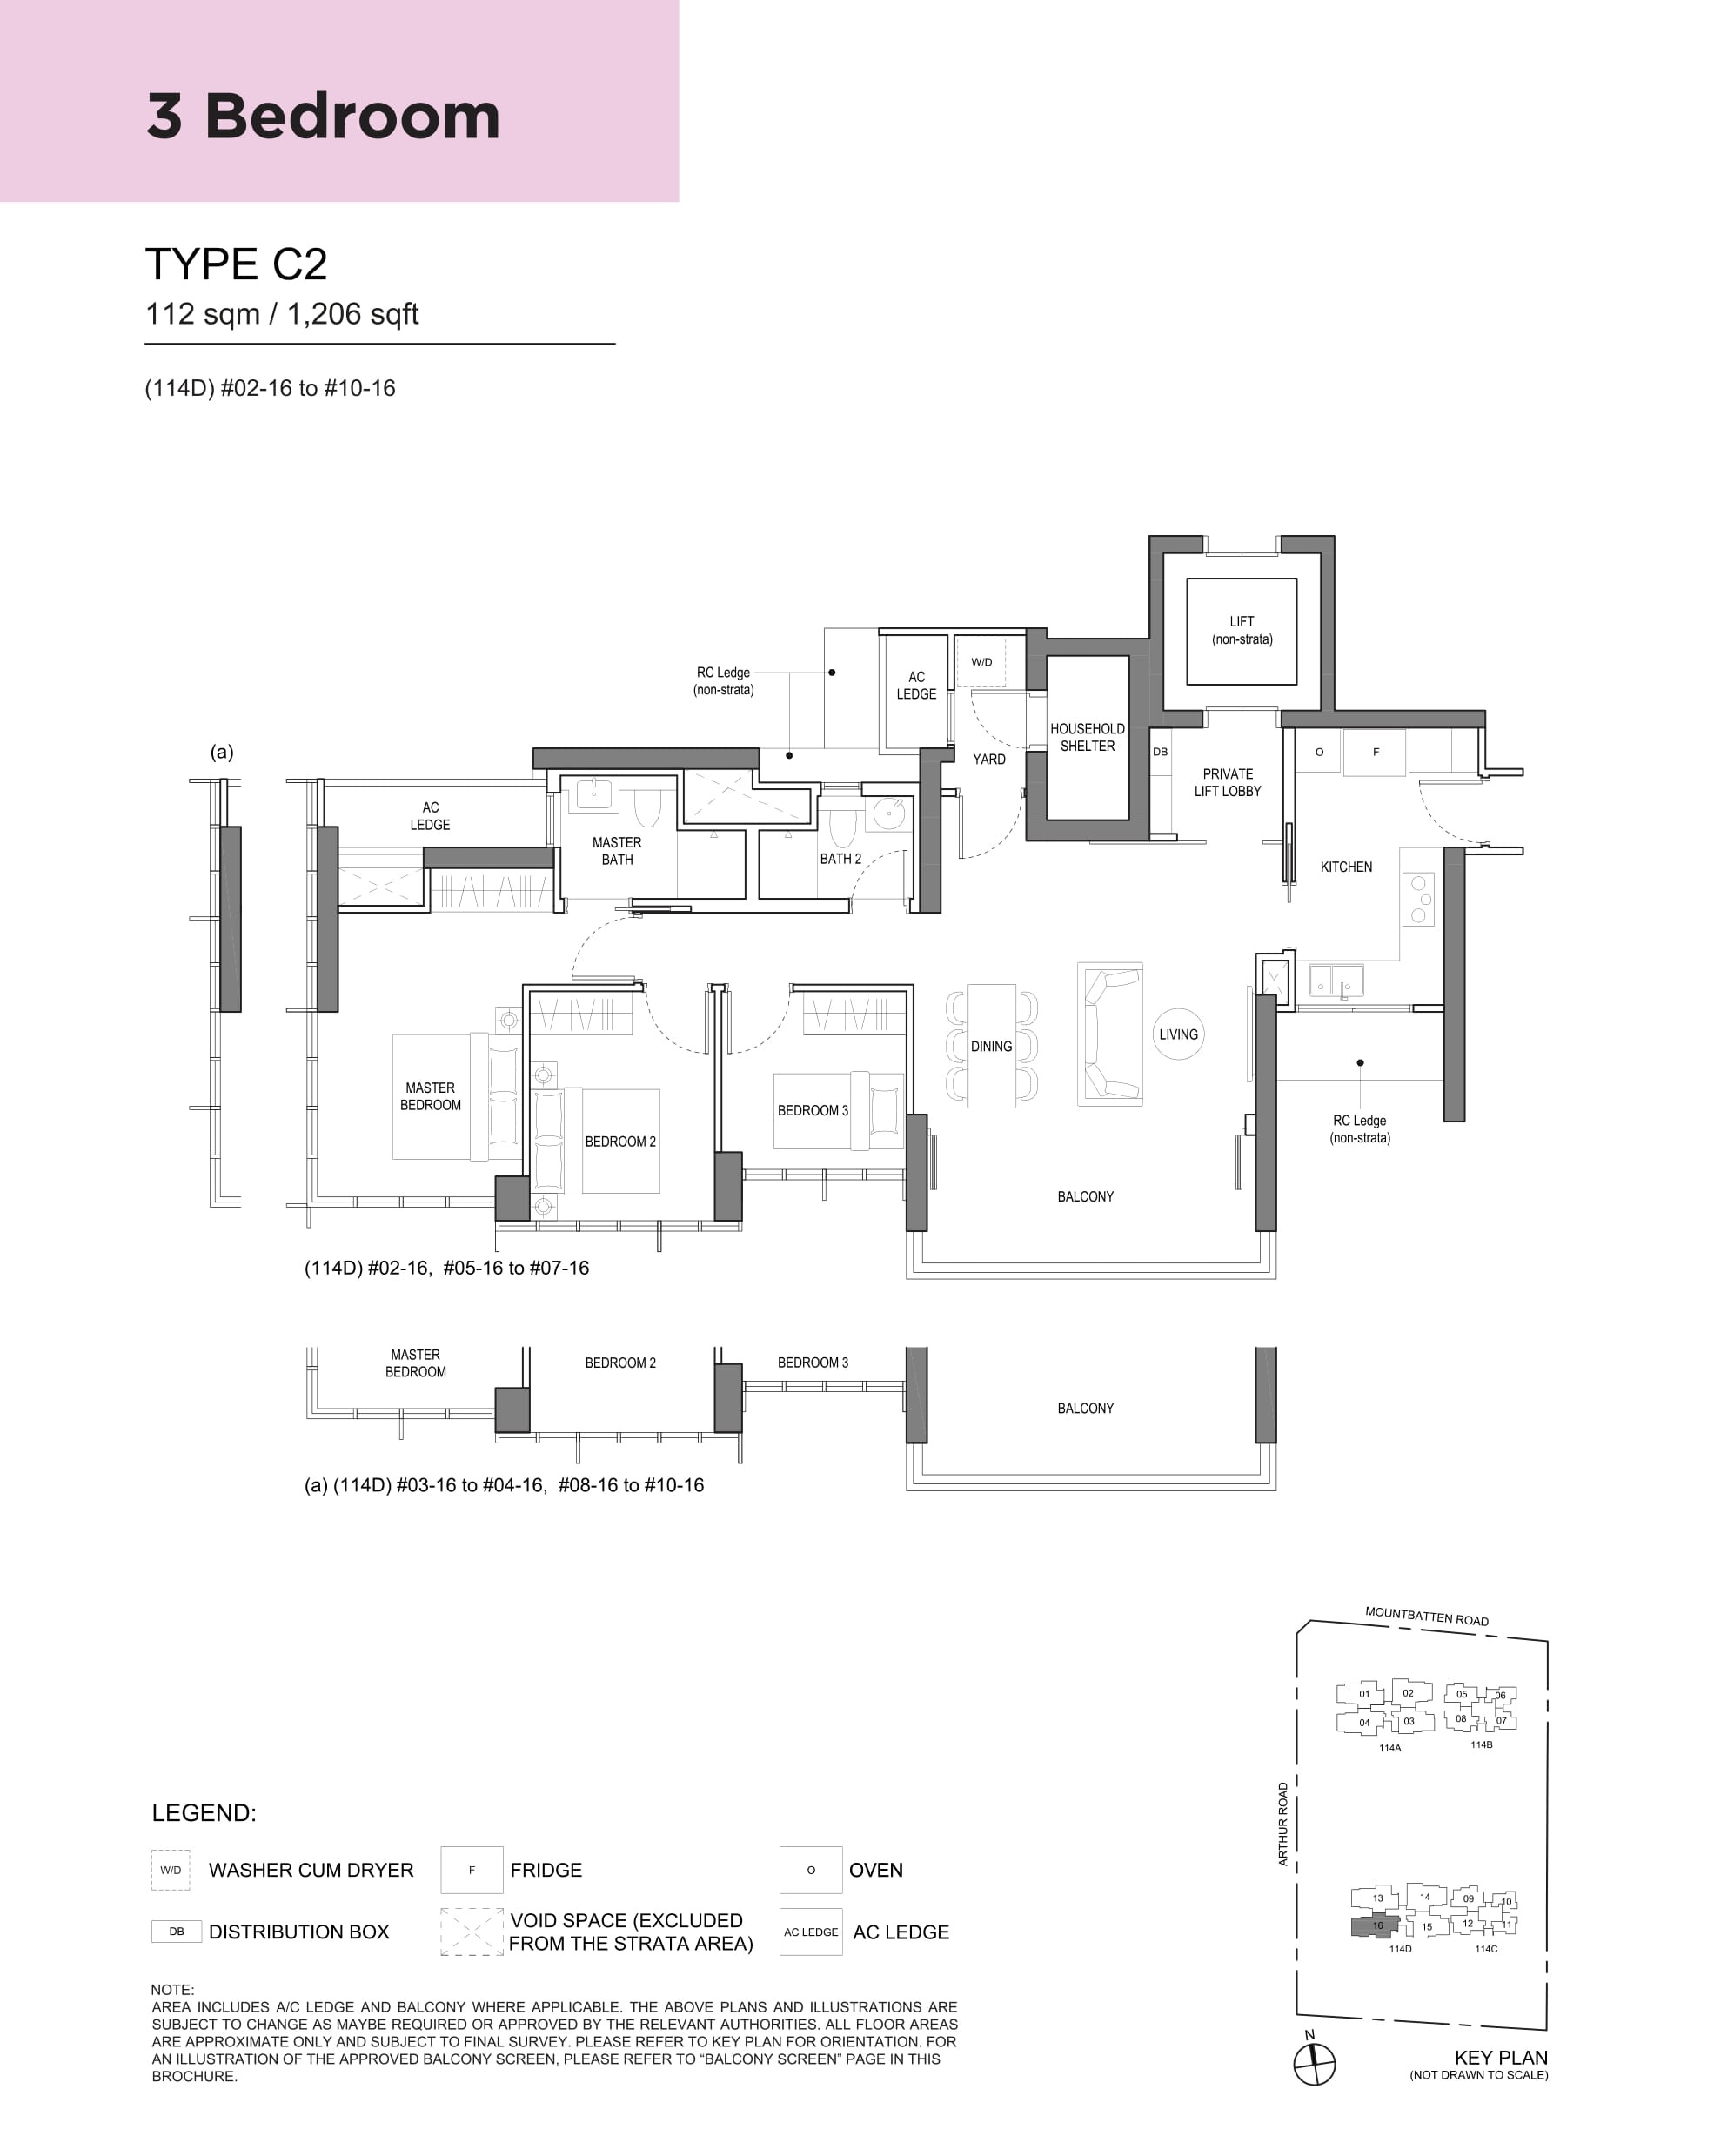
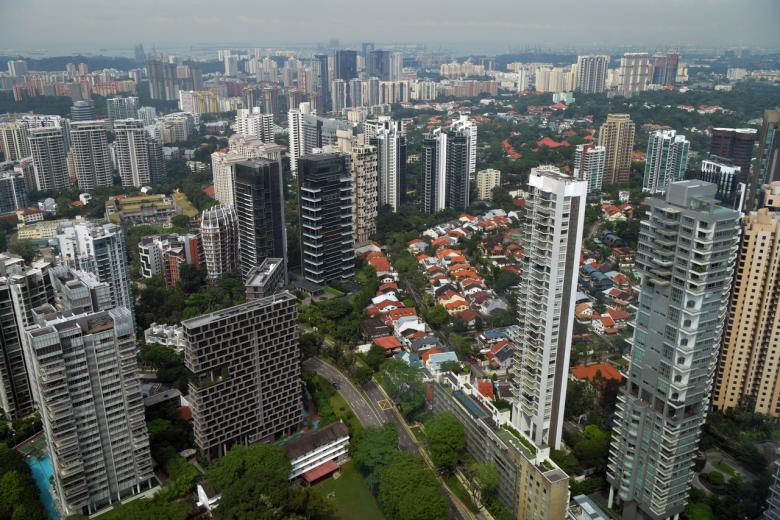
Developer: Bukit Sembawang Estates No. Of Units: 298 units Tenure: 99 year leasehold District: 15 Vacant Possession: 2024 Architect: Arc Studio Architectural + Urbanism Pte Ltd + Ong & Ong Pte Ltd Carpark: 285 basement car park lots Unit Types: 1-bedroom: 495 to 667 sqft (39 Units) 2-bedroom: 624 to 1044 sqft (113 Units) 3-bedroom: 1119 to 1453 sqft (118 Units) 4-bedroom: 1518 to 1668 sqft (28 Units)
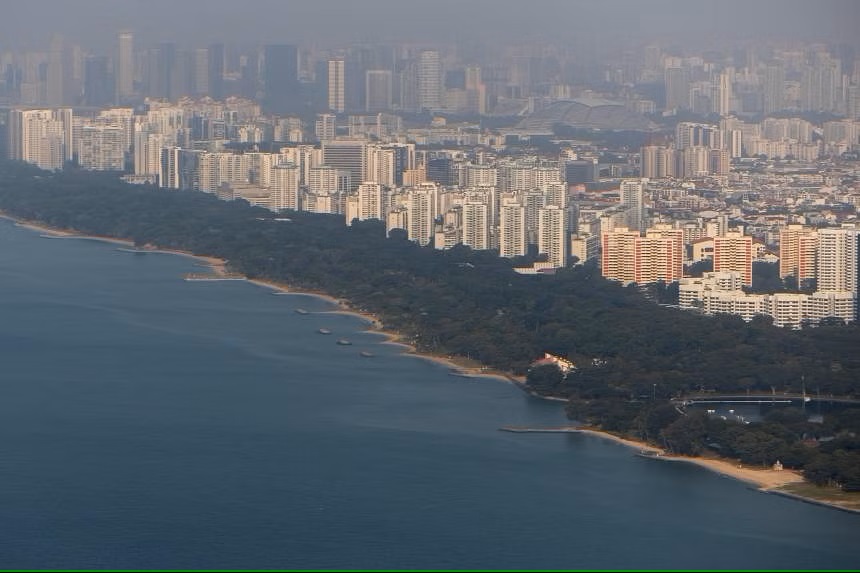
A Distinctive Lifestyle That Is Always In Style. In Style, Unique Lifestyle, Prime District 15, Coveted Mountbatten Conservation Enclave. Mountbatten in District 15 is the most prominent coastal conservation enclave in Singapore, highly desired for its seaside charms and rich heritage. Experience an enchantingly unique lifestyle that is imbued with a cosmopolitan vibe and filled with surprising discoveries every day. As the neighbourhood evolves into the future, look forward to even greater things to come.
The Essence Of Millionaires’ Row Back then, seaside bungalows dotted the coast, Trees gently swayed in the tropical breeze as laughter filled the air. Life just seemed more relaxed and tranquil here.
Today, this highly sought-after conservation enclave still exudes that idyllic seaside charm, exclusivity, and prestige. And this is your rare opportunity to live it, here at LIV@MB.
Be In All The Right Places Mountbatten is surrounded by the vibrant enclaves of Marine Parade, Katong and Joo Chiat, exciting Kallang and the world-class arts and entertainment choices of Marina Bay. And with its close proximity to the Central Business District (CBD), you can enjoy ultimate convenience from one location at LIV@MB.
The Address In Mountbatten LIV@MB is nestled within the prestigious Mountbatten enclave of District 15. It is proudly designed by ARC Studio, the firm headed by President’s Design award recipients.
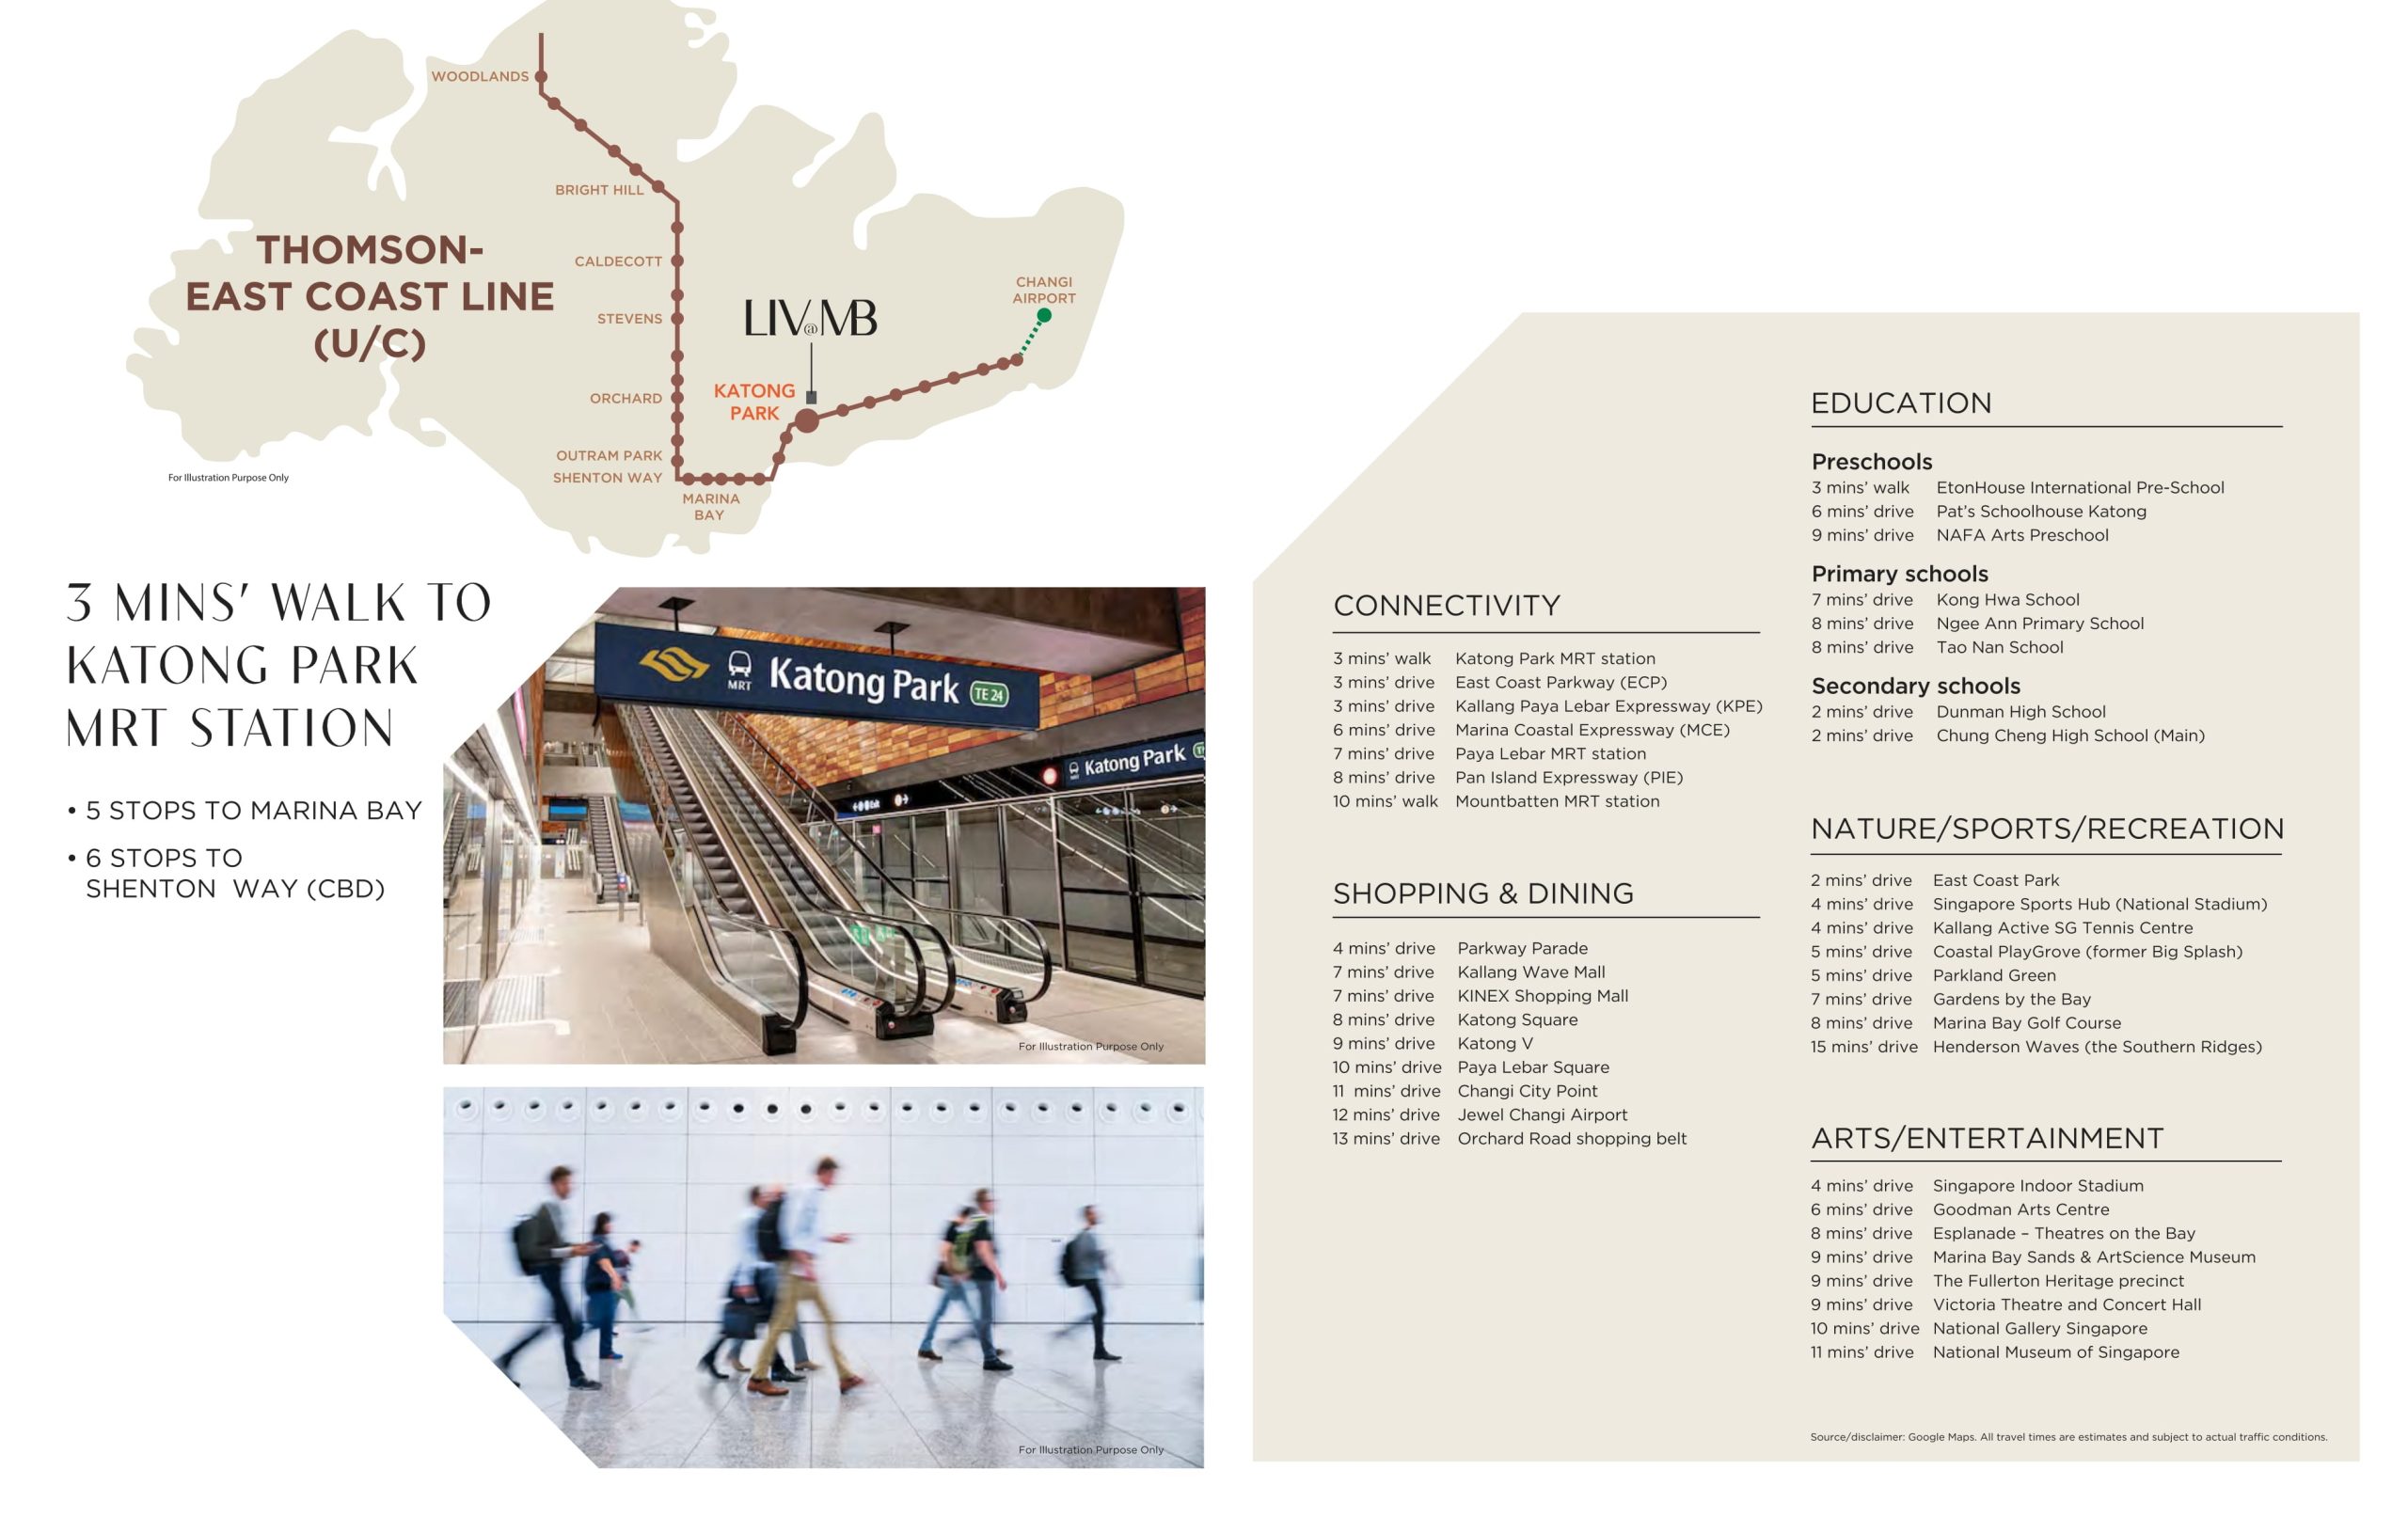
With Katong Park MRT station just 3 minutes’ walk away, LIV@MB offers great investment potential and opportunities for capital appreciation.
The Vision For A New Mountbatten Lifestyle
The East Coast Sustainability And GreeneryPlan
Live In Convenience. Be Everywhere In No Time
A City Of Opportunity Awaits Some of Singapore’s most eminent families have built their homes at Mountbatten because of its idyllic location that was still ideally close to the city centre. Some things never change. Live amidst the serenity you desire at LIV@MB, while staying connected to the excitement of the city which is just mere minutes away.
Where The World Comes To PlayMarina Bay Sands Marina Bay Sands, a short drive from LIV@MB, offers non-stop entertainment from dusk to dawn. Awaken to the beauty of its world-renowned rooftop infinity pool. A shopping experience like no other awaits at the exquisite boutiques. Dine on award-winning cuisine from around the world. Be entertained at the ArtScience Museum, catch a world-class performance, then party the night away.
Close To The Central Business District LIV@MB is only 3 minutes’ walk to the future Katong Park MRT station, and a short drive to the CBD, home to many regional offices of multinational corporations in the banking, financial and technology sectors. That makes commuting to and from work quicker so that you can concentrate on what is more important to you.
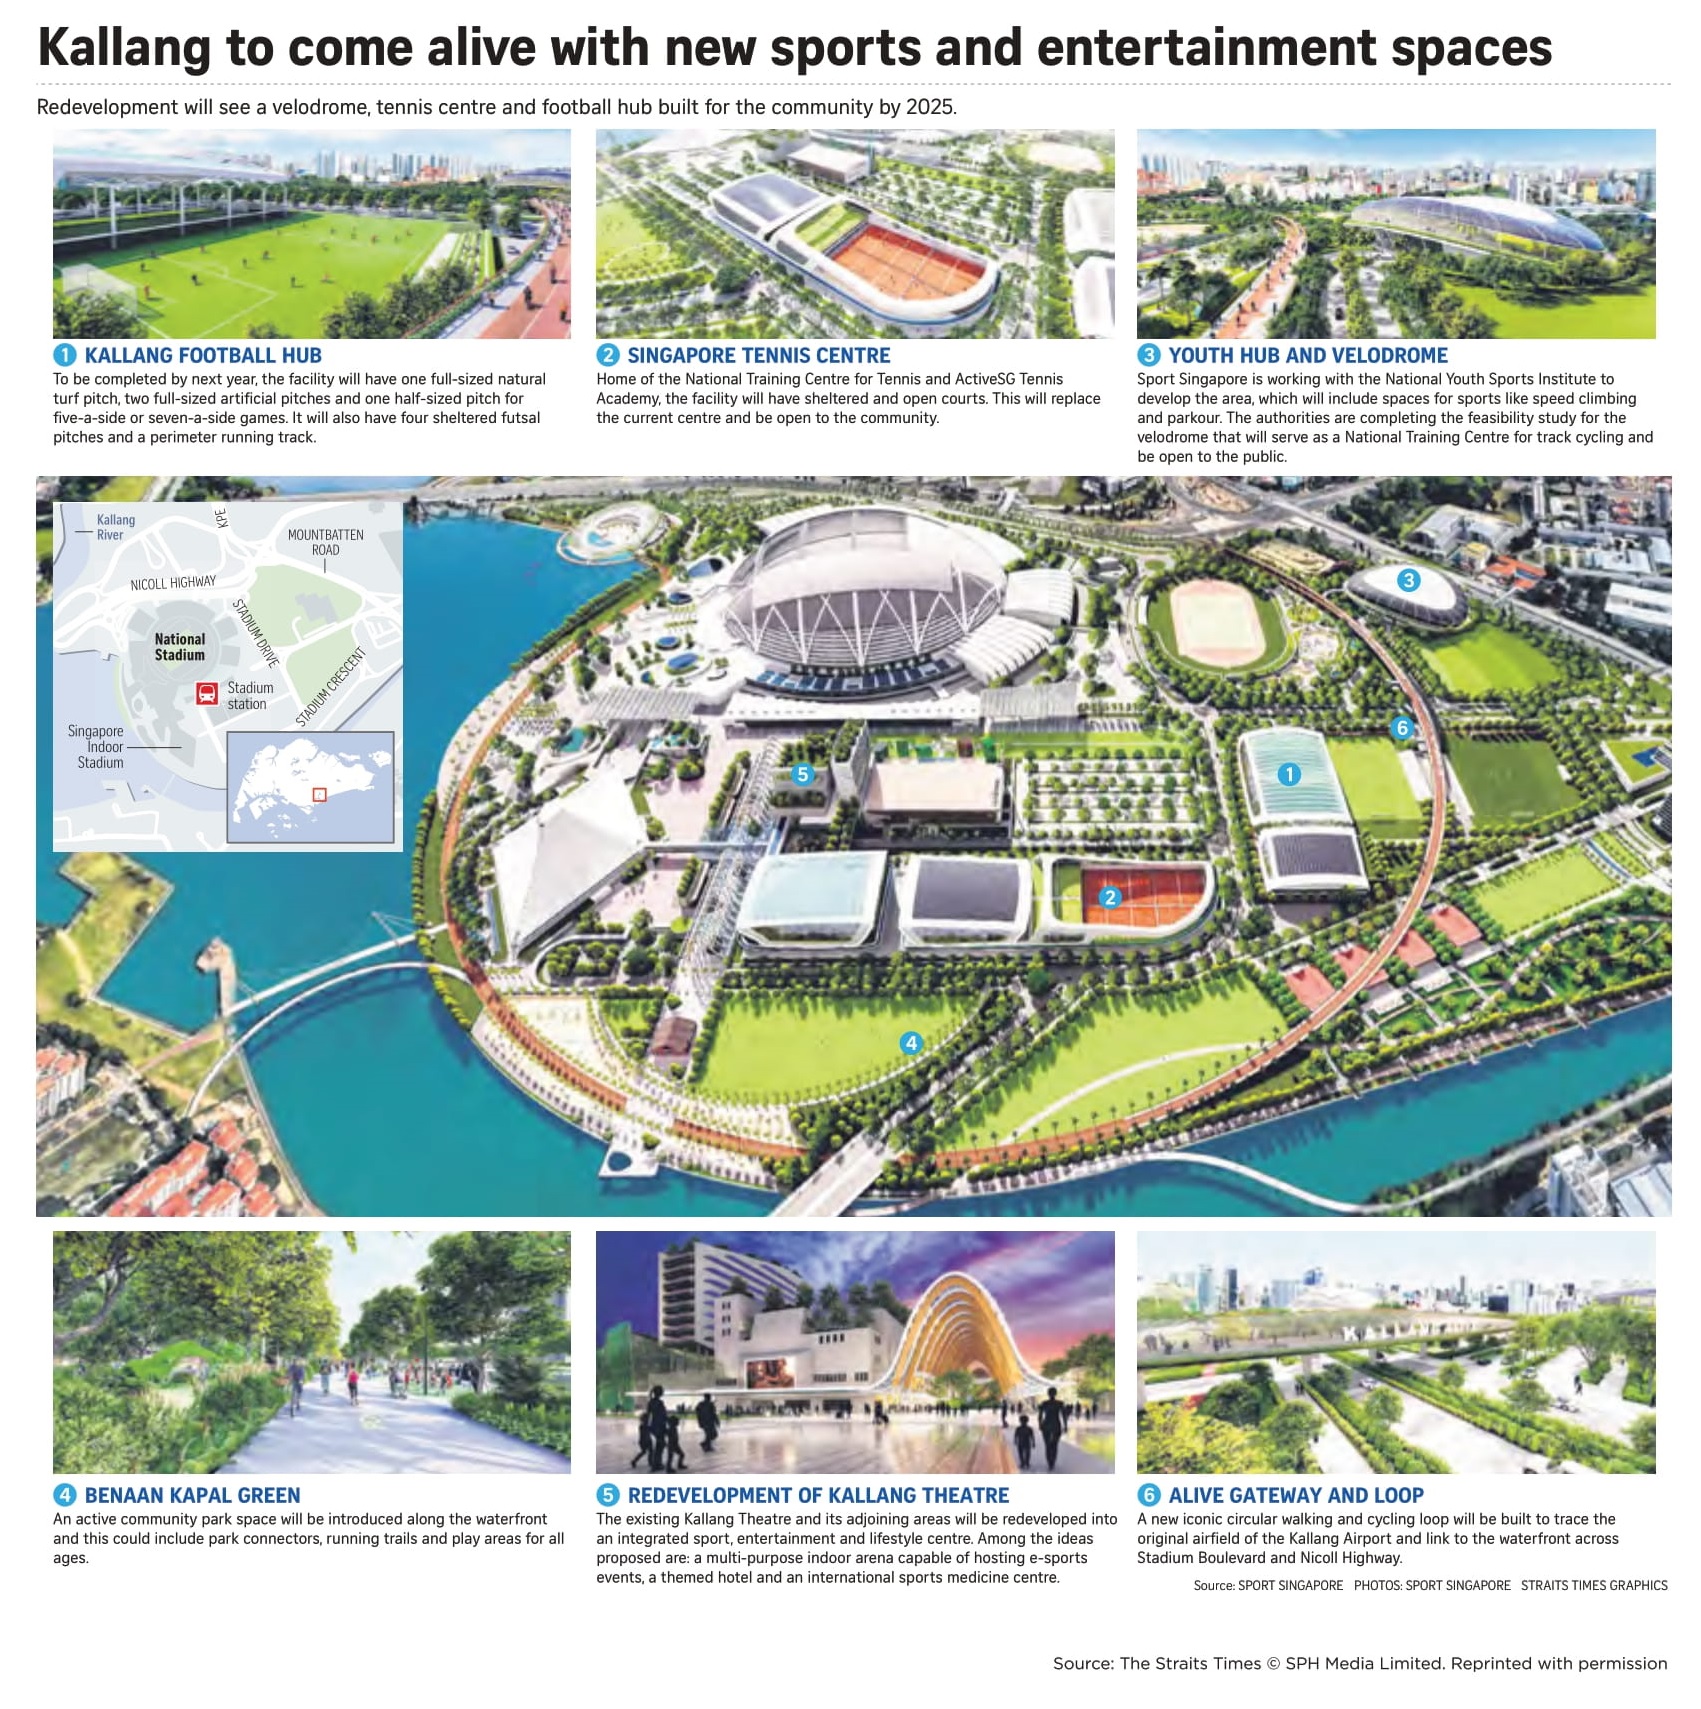
Play At The Bay This is Singapore Sports Hub, where sports-lovers come to engage in their favourite water and land sports. And where some of the world’s best performers entertain thousands at the Singapore Indoor Stadium. Future plans are afoot to enhance the sports-centric appeal of Kallang, and you will have the privilege of witnessing its transformation from your home at LIV@MB.
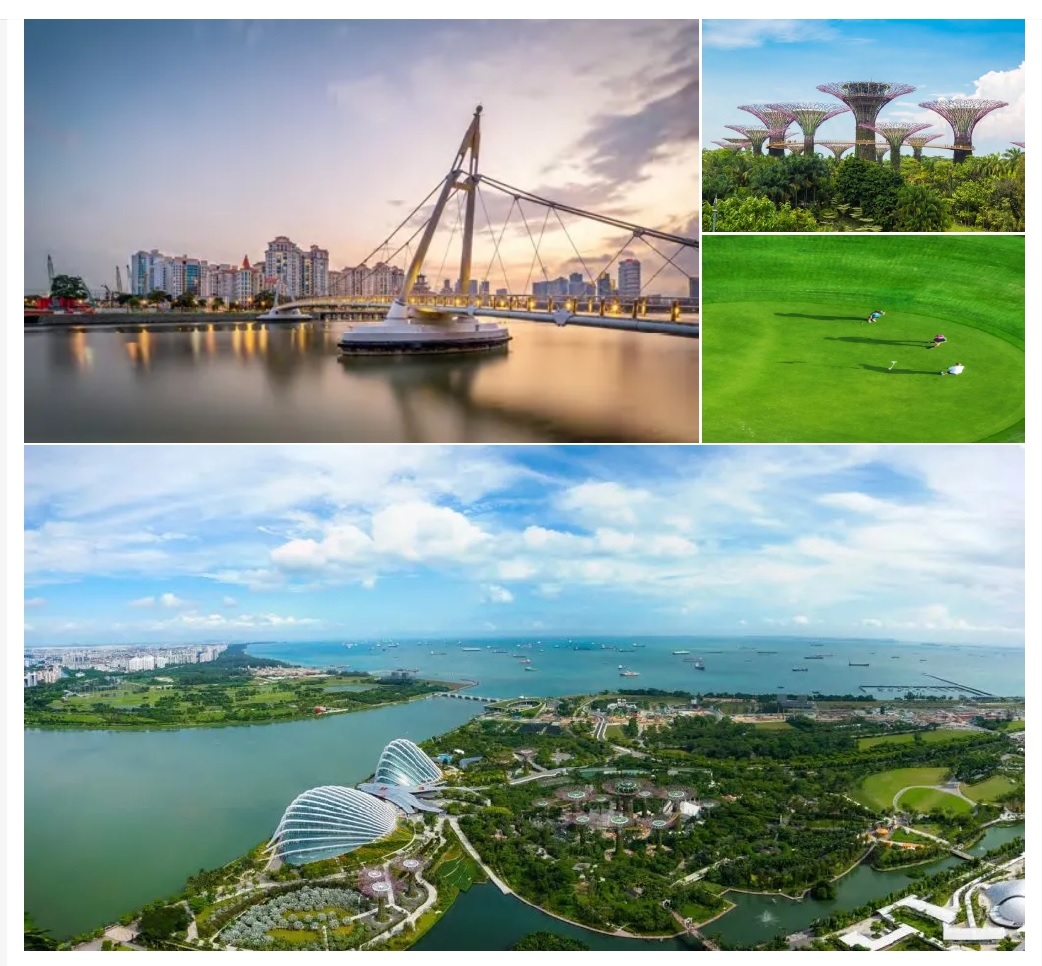
Where World-Class Leisure Choices Come Together Be enchanted by the exotic flora at Gardens by the Bay. Tee off at Marina Bay Golf Courses. Or head to the Singapore Sports Hub to get fit, watch a concert at the Singapore Indoor Stadium, or just spend an idyllic afternoon shopping and dining at Kallang Wave Mall. Discover them all just minutes from home.
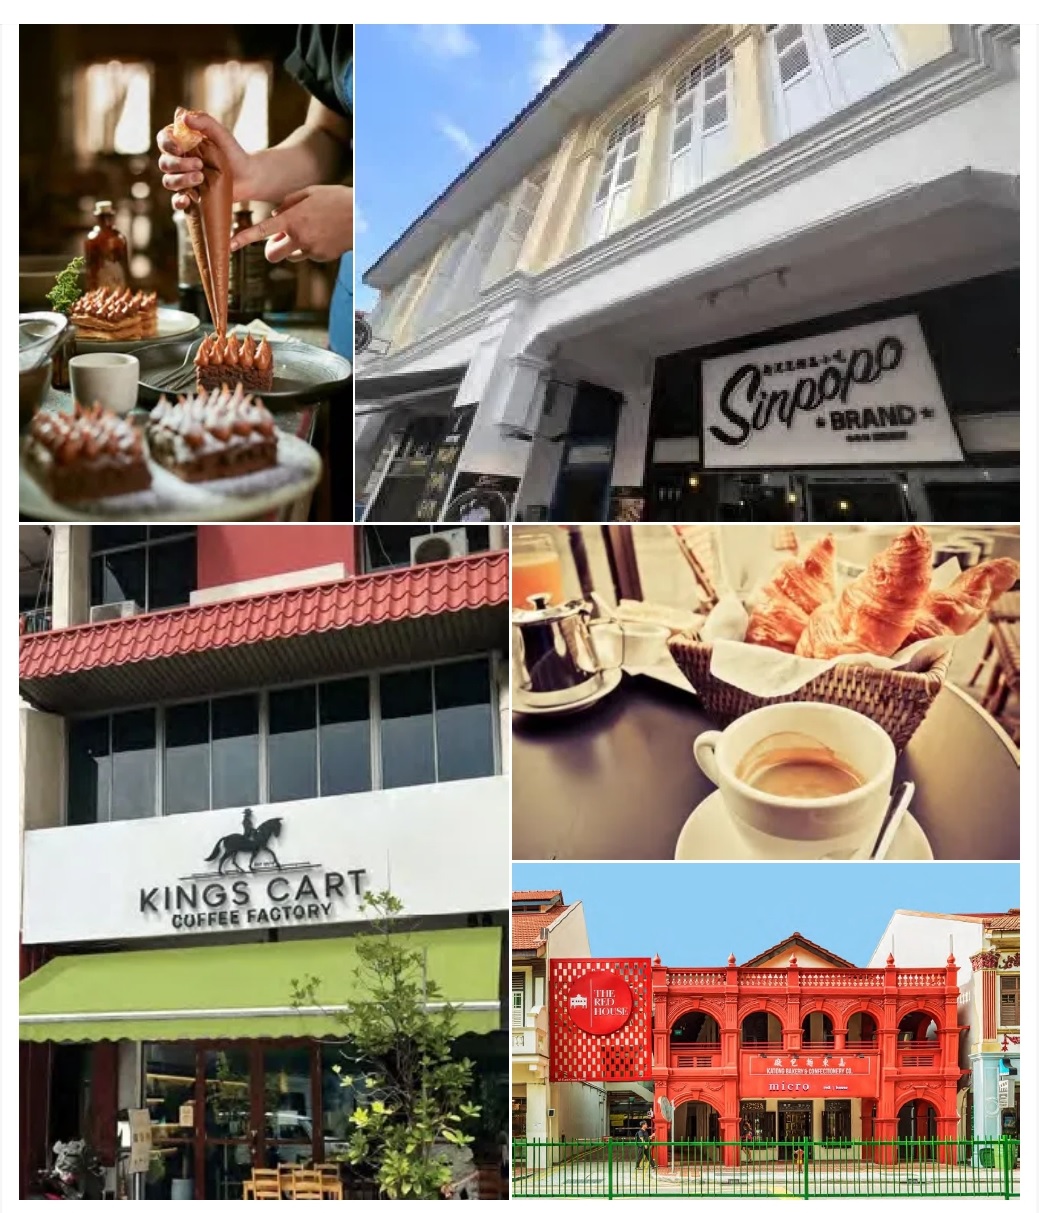
Tastes Of A Creative Culinary Community Brilliant bakes that draw in the crowds and artisan loaves made from scratch. Some of Singapore’s favourite bakeries are right here in your neighbourhood. Life can also be so much sweeter when tempting desserts and treats are within easy reach. Or just enjoy some time-out from the hustle and bustle of life to savour comfort food in cosy cafes in the company of your loved ones.
Discover A Wealth Of Choices Experience a new way of life. Where numerous shopping malls around you are now one-stop lifestyle destinations for the entire family. Shop for essentials or have a bite or two, while the kids attend enrichment classes. After which the whole family can bond together over a meal, delight in exploring the shops, or catch a fun movie at the cinema.
Good Education Builds A Strong Foundation Quality education as every stage of your child’s life is always within easy reach. LIV@MB is strongly supported by a vast selection of educational institutions, including some of Singapore’s most popular schools, near home.
Liv @ MB Location Map
Liv @ MB Street View
Liv @ MB Transacted Prices
Let’s Discuss Your Property Plans
Interested in This Property?
Buying, selling or renting? Get a free consultation with realtors with a background in interior and lighting design. We’ll discuss your goals and help you assess your options—from pricing and timelines to layout practicality and space potential.
Share your contact details below, and we will get in touch to understand your needs and suggest the next steps. No pressure. No obligation to proceed.
Other Topics That May Interest You
LIV @ MB Sales and Rental Transactions
Share a link to the applied filters and selected section. Figures update over time.
Property market snapshot
Prices, rents and activity
Oct 2025 – Sep 2026
Size and bedroom options show recorded transactions in the selected period; they do not describe every unit type in the development. The period ends before the current month. Sales filters apply to sales; bedroom selection applies to rentals. The same filters apply to the figures, charts and transaction tables below.
Median sale priceS$4,300,0002 single-unit sales · All sale typesLimited sample
Median sale PSFS$2,684 / sqft2 strata sales · All sale typesLimited sample
Median monthly rentS$4,60053 rental contracts
Recorded activity2 sale records53 rental contracts · selected period
The sale cards combine sale types. Choose New Sale, Sub Sale or Resale for a focused comparison; the size breakdown keeps those types separate.
Sale prices by unit size
Median transaction price; sale types shown separately. Bars share a zero-based scale within this panel. Select a size label to filter sales.
Medians describe the transactions in this view, not a valuation or a change in every home’s value. Middle 50% is the 25th–75th percentile, shown only with at least five observations; smaller groups are flagged. Minima and maxima are available in the breakdown tables. Percentiles use linear interpolation.
Price and PSF statistics include only sales explicitly recorded as one unit. Bulk sales and records with an unknown unit count remain in the detailed table when All unit sizes is selected. PSF uses unrounded strata area; size bands use rounded square feet. A size band does not identify bedrooms, penthouses, layout or unit condition.
Rental bedrooms are as reported; missing or non-numeric values are Not stated. Rental sizes are ranges. Rents and sales are separate samples: no project yield or exact rental PSF is inferred.
Discuss this property
Get a price or rental assessment
Request an assessment for your home or discuss rental potential based on comparable transactions.
LIV @ MB · Oct 2025 – Sep 2026 · All sale types · 1,500–1,999 sqft · All bedroom counts
Your enquiry will include the property, page URL and transaction filters shown above. Yield-calculator amounts are excluded.
Test your assumptions
Rental yield calculator
Enter a purchase price and monthly rent for the same home. Results update as you type. Your assumptions stay in this page while you change transaction filters; they are not submitted or saved.
Rental reference in the selected view: median S$4,600 / month from 53 contracts. These contracts may cover different-sized homes. Check the bedroom breakdown and records before choosing your rent assumption.
Optional vacancy and running expenses
Blank expense fields count as zero. Enter annual costs for the full year; they are not reduced during vacancy.
Enter purchase price and monthly rent to calculate.
Annual income after entered expenses = monthly rent × (12 − vacant months) − monthly maintenance × 12 − annual property tax − other annual running costs. Yield after entered expenses divides that income by purchase price.
Results use your assumptions and are indicative, before financing and personal income tax. The denominator excludes stamp duties, legal fees, renovation, furnishing and other acquisition costs. Include recurring insurance, repairs and letting costs in other running costs where relevant. No appreciation, mortgage repayment or return on equity is calculated. Historical rental contracts do not guarantee future rent or occupancy.
History and activity
How transactions changed over time
Monthly · Oct 2025 – Sep 2026
The active filters also apply here. Value axes start at zero and adjust to the selected records; check their labels when comparing views. Each point shows a period median; the bars below count recorded sales or rental contracts. Different sale types and rental bedroom counts have separate series. These changes can reflect the mix of homes transacted, rather than appreciation of an individual home.
Sale PSF history
Median S$/sqft for single-unit strata sales, by sale type.
Sub Sale
On a narrow screen, swipe the chart horizontally. Tap a point/bar or use the period controls for exact figures.
Jul 2026
1 sale records in this period.
Sub Sale: S$2,748 / sqft · 1 sale · limited sample
Exact history and activity table
Period
Sub Sale median PSF
Sub Sale sales
Sale records
Oct 2025
—
0
0
Nov 2025
—
0
0
Dec 2025
—
0
0
Jan 2026
—
0
0
Feb 2026
—
0
0
Mar 2026
—
0
0
Apr 2026
S$2,620
1 (limited)
1
May 2026
—
0
0
Jun 2026
—
0
0
Jul 2026
S$2,748
1 (limited)
1
Aug 2026
—
0
0
Sep 2026
—
0
0
Monthly rent history
Median monthly rent in S$, by reported bedroom count.
1 bedroom2 bedrooms3 bedroomsNot stated
On a narrow screen, swipe the chart horizontally. Tap a point/bar or use the period controls for exact figures.
Filled points have at least five qualifying observations; hollow points have fewer than five. Lines join only adjacent filled points. Gaps are not estimated or filled with zeros. For five-year views, edge quarters marked * may contain fewer than three selected months. Sale activity bars include all selected sale records; PSF points use only qualifying single-unit strata sales.
Individual sale comparison
Sale price versus unit size
Oct 2025 – Sep 2026 · 2 qualifying sale records. The period, sale-type and unit-size filters above apply. Bedroom filters affect rentals only
Each plotted position represents one or more sales at that size and price. Tap a marker or select a record below for its contract month, floor range and PSF. Markers with a number contain multiple records; none are discarded.
Sub Sale
Both axes start at zero and adjust to the selected sales. All qualifying sales, including extreme values, remain shown. Swipe horizontally on a narrow screen. Identical positions are grouped without moving the data points. Nearby markers can overlap; the selector and table retain every eligible record.
#1 · Jul 2026 · Sub Sale · 1,528 sqft · S$4,200,000 · floor 16-20
S$2,748 / sqft
Exact plotted sales table
Record
Contract month
Sale type
Floor range
Size (sqft)
Price (S$)
PSF (S$/sqft)
1
Jul 2026
Sub Sale
16-20
1,528
4,200,000
2,748
2
Apr 2026
Sub Sale
11-15
1,679
4,400,000
2,620
0 selected records excluded from this plot: only explicitly single-unit strata sales with positive numeric prices and areas qualify. Size positions and PSF use unrounded area; displayed sizes are rounded. Record numbers refer to this view and are not unit identifiers. No fitted price or valuation is inferred.
Sales Transactions
Contract month
Type of sale
Floor range
Area (sqft)
Sale price (S$)
Price (S$/sqft)
Units in transaction
Jul 2026
Sub Sale
16-20
1,528
4,200,000
2,748
1
Apr 2026
Sub Sale
11-15
1,679
4,400,000
2,620
1
Last downloaded: 26 Oct 2026, 15:53 SGT. 2 matching records in the selected period.
Rental Contracts
Latest recorded lease start: Sep 2026.
Lease start month
Bedrooms
Area range (sqft)
Monthly rent (S$)
Oct 2025
Not stated
400-500
3,750
Oct 2025
Not stated
400-500
3,500
Oct 2025
Not stated
1100-1200
7,500
Last downloaded: 26 Oct 2026, 14:05 SGT. 53 matching records in the selected period.
Source: Urban Redevelopment Authority (URA), accessed through the URA Data Service. Data made available under the Singapore Open Data Licence. Areas are rounded; rental areas are ranges. Records may be revised and do not identify exact units. Multiple transactions in the same month are not ordered by day. These records are historical transactions, not current listings or valuations.