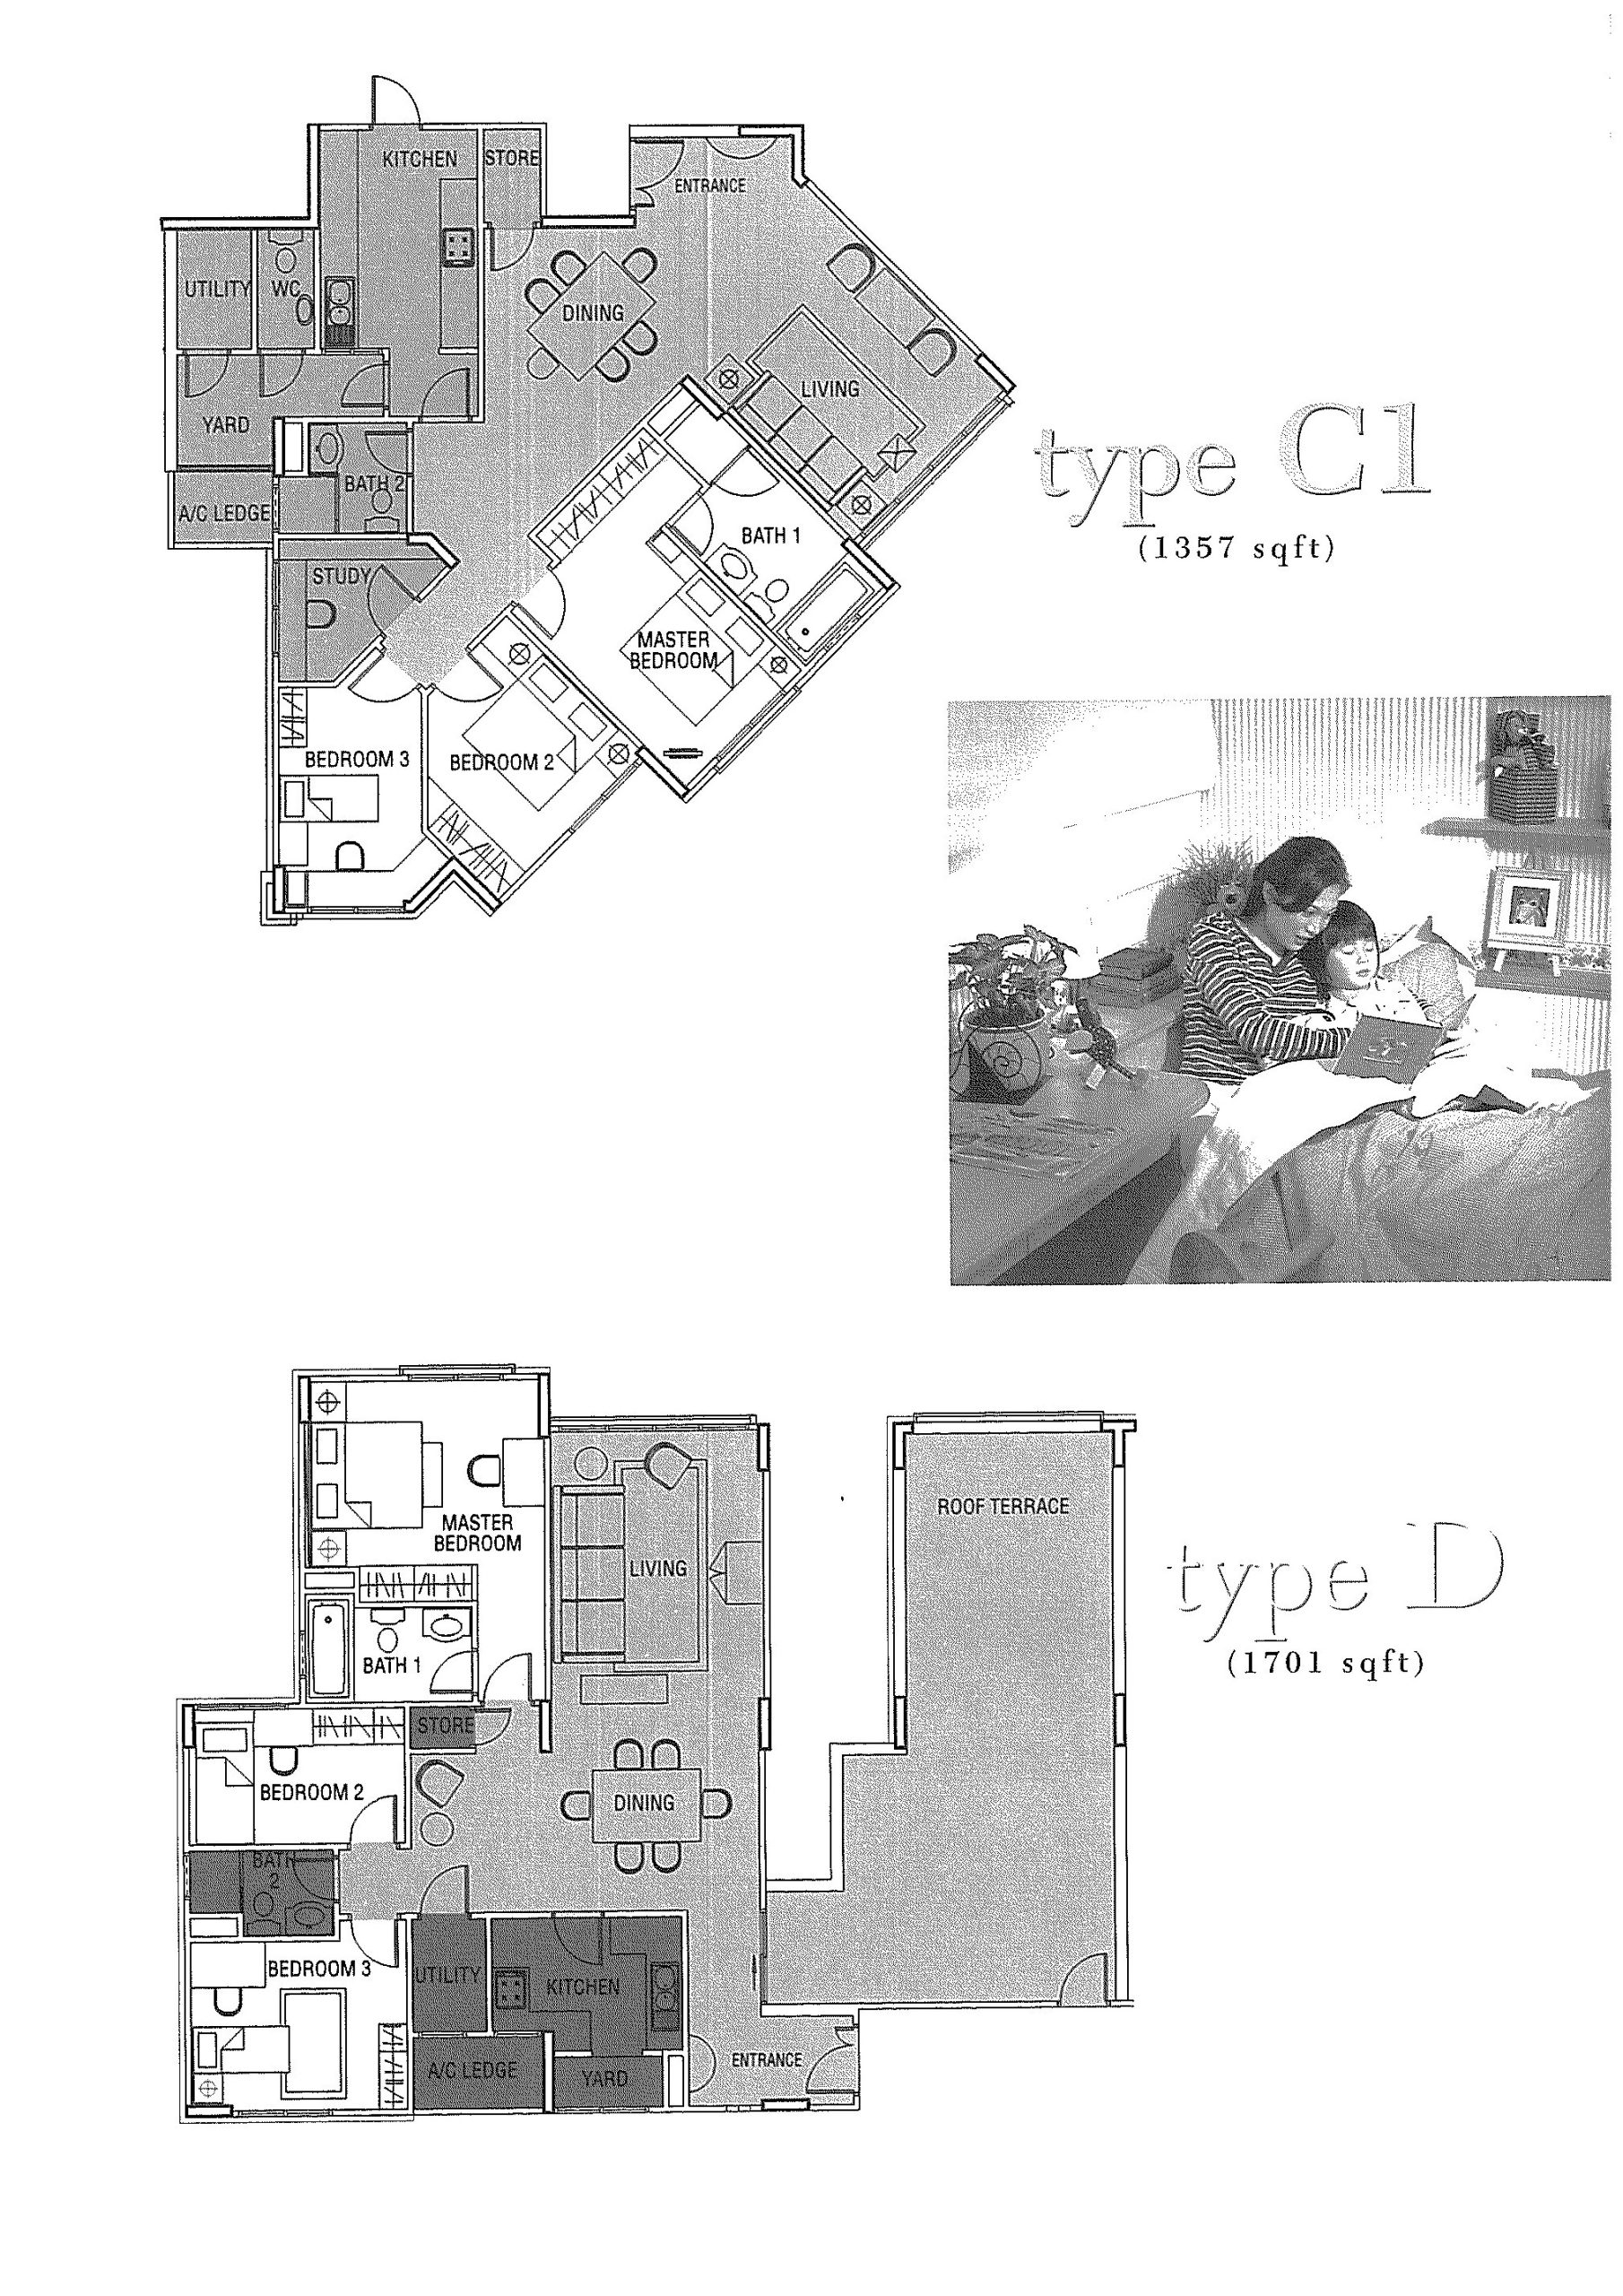
Developer: NTUC Choice Homes Co-Operative Ltd No. Of Units: 602 Residential Units Tenure: 99 Year Leasehold District: 18 TOP: 1999 Unit Types:
3 Bedroom (969 to 1712 sqft)
The Good Life
Life has been a long journey. You’ve made strides in your career. Fostered a close family. It’s time to reach for the good life. An inspiring style of living for the successful individual. A dream home come true.
Embrace a lifestyle that’s symbolic of your success. A whole new standard of living that expresses your ambitions and ideals. A place you can truly call Home.
NTUC Choice Homes brings you Simei Green. Executive condominium luxury deserving of today’s modern family living.
You can be a part of the Good Life too.
Exclusive East Coast Location
The serene East Coast with her distinctive charm. Retreat into a suburbia away from the hustle and bustle of city life, yet just minutes from established amenities and favourite haunts.
Bask in the sun, sand and sea. Race your children at cycling, canoeing or sailing. Spend an enchanting evening on the beach with your loved ones. As the day draws to a smooth close, settle down for a congenial seafood dinner with your family. In the heart of Singapore’s seafood paradise.
An idyllic setting. For the perfect family life.
Imagine a garden haven that soothes after a hard day’s work. Seven towers set in a private little world in Simei. 602 apartments designed with the quality finishes you can expect from an investment that lasts a lifetime. Complete with a covered carpark and 24-hour security. For your peace of mind.
Rest in the tranquility of the garden pavilions. Have a stroll on the lush walkways. Take in the greenery. You’ll soon discover why we chose the name Simei Green.
Simei Green offers strategic links with Singapore’s major transport network. With the Simet MRT, the ECP, PIE and TPE just minutes away, you’re never too far from town. Or anywhere else in Singapore.
Whether it’s your workplace or your favourite shopping haunt, Simei Green will connect you to a kind of lifestyle you desire.
A family that plays together, stays together. At Simei Green, you can look forward to spending quality leisure with your family. Right at home. Relax over a private barbeque with your family or friends at the BBQ area. Let the kids romp in the playground. Take a dip in the pool. Or wind down in a sauna over at the clubhouse. There’s a putting green, tennis court and a gym for a healthy lifestyle taht starts right at home. Whichever you choose, leisure with your family will never be the same again.
Luxury is the defining theme for Simei Green’s apartments. Step into a whole new world created just for you and your family’s private moments. A whole new look that’s not only modern, but enduring as well.
Stylish marble flooring adds an executive touch to the living and dining areas. The extensive view from the living room opens up to a whole new feel when you entertain at home. Imagine dining in the grandeur of a landscape backdrop… for every family meal.
After a day’s work, come home to a restful night in the bedrooms where cosy parquet sets the mood for relaxation. Indulge in total living comfort with a multi-split aircon system and built-in wardrobes.
Cooking will be a breeze with a modern kitchen that combines function and aesthetics in a clean statement. Fully fitted with designer cabinets, a cooking hob and hood and ceramic flooring. It’s enough to put anyone in the mood for home-cooking.
Simei Green Location Map
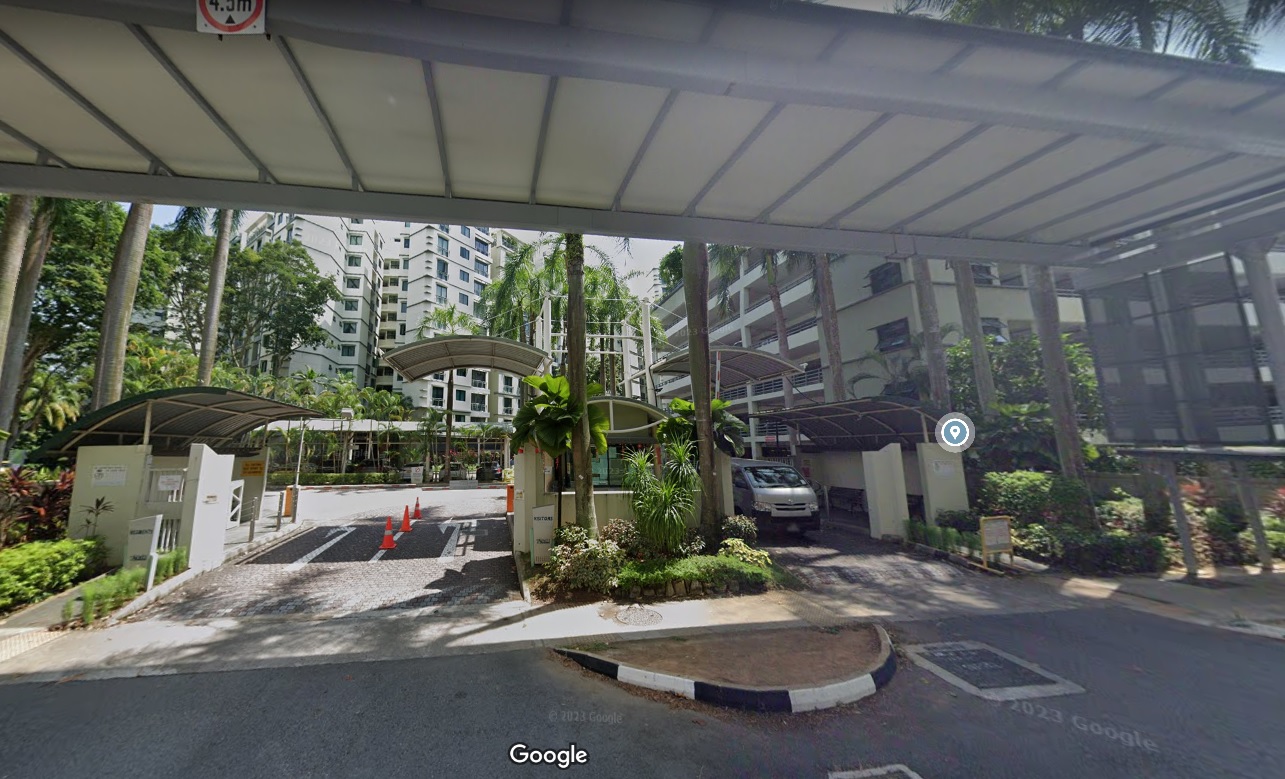
Simei Green Street View
Simei Green Resale/Rental Prices
Let’s Discuss Your Property Plans
Interested in This Property?
Buying, selling or renting? Get a free consultation with realtors with a background in interior and lighting design. We’ll discuss your goals and help you assess your options—from pricing and timelines to layout practicality and space potential.
Share your contact details below, and we will get in touch to understand your needs and suggest the next steps. No pressure. No obligation to proceed.
Other Topics That May Interest You
SIMEI GREEN CONDOMINIUM Sales and Rental Transactions
Share a link to the applied filters and selected section. Figures update over time.
Property market snapshot
Prices, rents and activity
Oct 2025 – Sep 2026
Size and bedroom options show recorded transactions in the selected period; they do not describe every unit type in the development. The period ends before the current month. Sales filters apply to sales; bedroom selection applies to rentals. The same filters apply to the figures, charts and transaction tables below.
SIMEI GREEN CONDOMINIUM · Oct 2025 – Sep 2026 The imported URA data contains 8 sales and 82 rental contracts matching the selected period and filters.
Median single-unit sale price: S$1,400,000, based on 8 sales. Median strata sale price per square foot: S$1,130 / sqft, based on 8 sales. Median monthly rent: S$4,100, based on 82 rental contracts.
Sale type: All sale types. Sales unit size: 1,000–1,499 sqft. Rental bedrooms: All bedroom counts. Historical transactions describe this sample, not current asking prices, rental listings or a valuation.
Median sale priceS$1,400,0008 single-unit sales · All sale types
Median sale PSFS$1,130 / sqft8 strata sales · All sale types
Median monthly rentS$4,10082 rental contracts
Recorded activity8 sale records82 rental contracts · selected period
The sale cards combine sale types. Choose New Sale, Sub Sale or Resale for a focused comparison; the size breakdown keeps those types separate.
Sale prices by unit size
Median transaction price; sale types shown separately. Bars share a zero-based scale within this panel. Select a size label to filter sales.
Medians describe the transactions in this view, not a valuation or a change in every home’s value. Middle 50% is the 25th–75th percentile, shown only with at least five observations; smaller groups are flagged. Minima and maxima are available in the breakdown tables. Percentiles use linear interpolation.
Price and PSF statistics include only sales explicitly recorded as one unit. Bulk sales and records with an unknown unit count remain in the detailed table when All unit sizes is selected. PSF uses unrounded strata area; size bands use rounded square feet. A size band does not identify bedrooms, penthouses, layout or unit condition.
Rental bedrooms are as reported; missing or non-numeric values are Not stated. Rental sizes are ranges. Rents and sales are separate samples: no project yield or exact rental PSF is inferred.
Discuss this property
Get a price or rental assessment
Request an assessment for your home or discuss rental potential based on comparable transactions.
SIMEI GREEN CONDOMINIUM · Oct 2025 – Sep 2026 · All sale types · 1,000–1,499 sqft · All bedroom counts
Your enquiry will include the property, page URL and transaction filters shown above. Yield-calculator amounts are excluded.
Test your assumptions
Rental yield calculator
Enter a purchase price and monthly rent for the same home. Results update as you type. Your assumptions stay in this page while you change transaction filters; they are not submitted or saved.
Rental reference in the selected view: median S$4,100 / month from 82 contracts. These contracts may cover different-sized homes. Check the bedroom breakdown and records before choosing your rent assumption.
Optional vacancy and running expenses
Blank expense fields count as zero. Enter annual costs for the full year; they are not reduced during vacancy.
Enter purchase price and monthly rent to calculate.
Annual income after entered expenses = monthly rent × (12 − vacant months) − monthly maintenance × 12 − annual property tax − other annual running costs. Yield after entered expenses divides that income by purchase price.
Results use your assumptions and are indicative, before financing and personal income tax. The denominator excludes stamp duties, legal fees, renovation, furnishing and other acquisition costs. Include recurring insurance, repairs and letting costs in other running costs where relevant. No appreciation, mortgage repayment or return on equity is calculated. Historical rental contracts do not guarantee future rent or occupancy.
History and activity
How transactions changed over time
Monthly · Oct 2025 – Sep 2026
The active filters also apply here. Value axes start at zero and adjust to the selected records; check their labels when comparing views. Each point shows a period median; the bars below count recorded sales or rental contracts. Different sale types and rental bedroom counts have separate series. These changes can reflect the mix of homes transacted, rather than appreciation of an individual home.
Sale PSF history
Median S$/sqft for single-unit strata sales, by sale type.
Resale
On a narrow screen, swipe the chart horizontally. Tap a point/bar or use the period controls for exact figures.
Aug 2026
1 sale records in this period.
Resale: S$1,163 / sqft · 1 sale · limited sample
Exact history and activity table
Period
Resale median PSF
Resale sales
Sale records
Oct 2025
—
0
0
Nov 2025
—
0
0
Dec 2025
S$1,131
1 (limited)
1
Jan 2026
S$1,098
1 (limited)
1
Feb 2026
S$1,155
1 (limited)
1
Mar 2026
S$1,163
2 (limited)
2
Apr 2026
S$1,032
1 (limited)
1
May 2026
S$1,097
1 (limited)
1
Jun 2026
—
0
0
Jul 2026
—
0
0
Aug 2026
S$1,163
1 (limited)
1
Sep 2026
—
0
0
Monthly rent history
Median monthly rent in S$, by reported bedroom count.
3 bedrooms
On a narrow screen, swipe the chart horizontally. Tap a point/bar or use the period controls for exact figures.
Sep 2026
6 rental contracts in this period.
3 bedrooms: S$4,300 / month · 6 rental contracts
Exact history and activity table
Period
3 bedrooms median rent
3 bedrooms rental contracts
Rental contracts
Oct 2025
S$4,000
7
7
Nov 2025
S$4,225
8
8
Dec 2025
S$4,000
5
5
Jan 2026
S$4,000
9
9
Feb 2026
S$4,100
7
7
Mar 2026
S$4,250
9
9
Apr 2026
S$4,250
4 (limited)
4
May 2026
S$4,000
9
9
Jun 2026
S$4,100
3 (limited)
3
Jul 2026
S$4,200
5
5
Aug 2026
S$4,100
10
10
Sep 2026
S$4,300
6
6
Filled points have at least five qualifying observations; hollow points have fewer than five. Lines join only adjacent filled points. Gaps are not estimated or filled with zeros. For five-year views, edge quarters marked * may contain fewer than three selected months. Sale activity bars include all selected sale records; PSF points use only qualifying single-unit strata sales.
Individual sale comparison
Sale price versus unit size
Oct 2025 – Sep 2026 · 8 qualifying sale records. The period, sale-type and unit-size filters above apply. Bedroom filters affect rentals only
Each plotted position represents one or more sales at that size and price. Tap a marker or select a record below for its contract month, floor range and PSF. Markers with a number contain multiple records; none are discarded.
Resale
Both axes start at zero and adjust to the selected sales. All qualifying sales, including extreme values, remain shown. Swipe horizontally on a narrow screen. Identical positions are grouped without moving the data points. Nearby markers can overlap; the selector and table retain every eligible record.
0 selected records excluded from this plot: only explicitly single-unit strata sales with positive numeric prices and areas qualify. Size positions and PSF use unrounded area; displayed sizes are rounded. Record numbers refer to this view and are not unit identifiers. No fitted price or valuation is inferred.
Sales Transactions
Contract month
Type of sale
Floor range
Area (sqft)
Sale price (S$)
Price (S$/sqft)
Units in transaction
Aug 2026
Resale
06-10
1,195
1,390,000
1,163
1
May 2026
Resale
06-10
1,249
1,370,000
1,097
1
Apr 2026
Resale
01-05
1,249
1,288,888
1,032
1
Mar 2026
Resale
01-05
1,249
1,410,000
1,129
1
Mar 2026
Resale
01-05
1,195
1,430,000
1,197
1
Feb 2026
Resale
06-10
1,195
1,380,000
1,155
1
Jan 2026
Resale
01-05
1,356
1,488,888
1,098
1
Dec 2025
Resale
06-10
1,249
1,411,919
1,131
1
Last downloaded: 29 Oct 2026, 12:21 SGT. 8 matching records in the selected period.
Rental Contracts
Latest recorded lease start: Sep 2026.
Lease start month
Bedrooms
Area range (sqft)
Monthly rent (S$)
Aug 2026
3
1200-1300
4,100
Aug 2026
3
900-1000
3,800
Aug 2026
3
1100-1200
4,100
Aug 2026
3
1300-1400
4,000
Aug 2026
3
1300-1400
5,200
Aug 2026
3
1300-1400
4,600
Jul 2026
3
1300-1400
4,200
Jul 2026
3
900-1000
4,200
Jul 2026
3
900-1000
3,850
Jul 2026
3
1100-1200
4,700
Last downloaded: 27 Oct 2026, 17:10 SGT. 82 matching records in the selected period.
Source: Urban Redevelopment Authority (URA), accessed through the URA Data Service. Data made available under the Singapore Open Data Licence. Areas are rounded; rental areas are ranges. Records may be revised and do not identify exact units. Multiple transactions in the same month are not ordered by day. These records are historical transactions, not current listings or valuations.