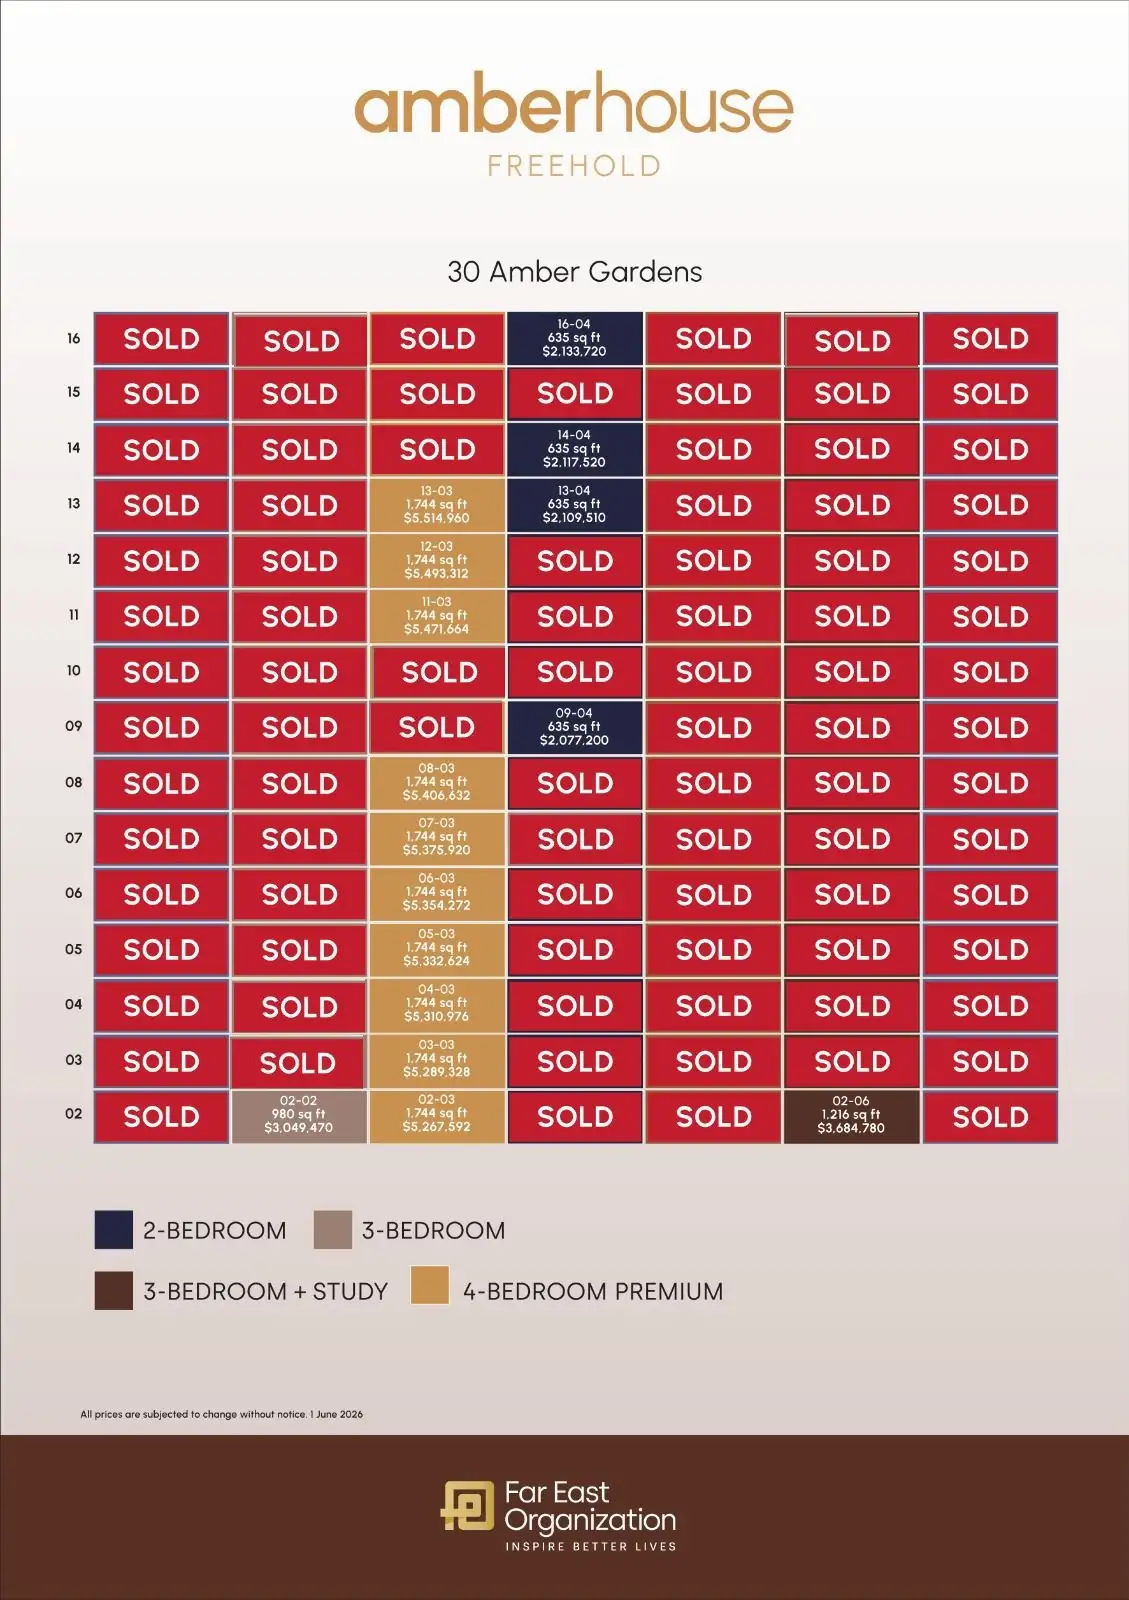
Architect: ADDP Architects LLP Site Area: Approximate 3,801.4 sq m | Approximate 40,918.27 sq ft Carpark: 105 lots + 3 accessible lots (inclusive of 2 active EV charging lots)
About Amber House
Now and Always, Where Life is Infinitely Vivid
Amber House is a modern interpretation
of East Coast grandeur.
A limited edition, freehold boutique development of just 105 units, designed for those who value intimate, distinctive spaces.
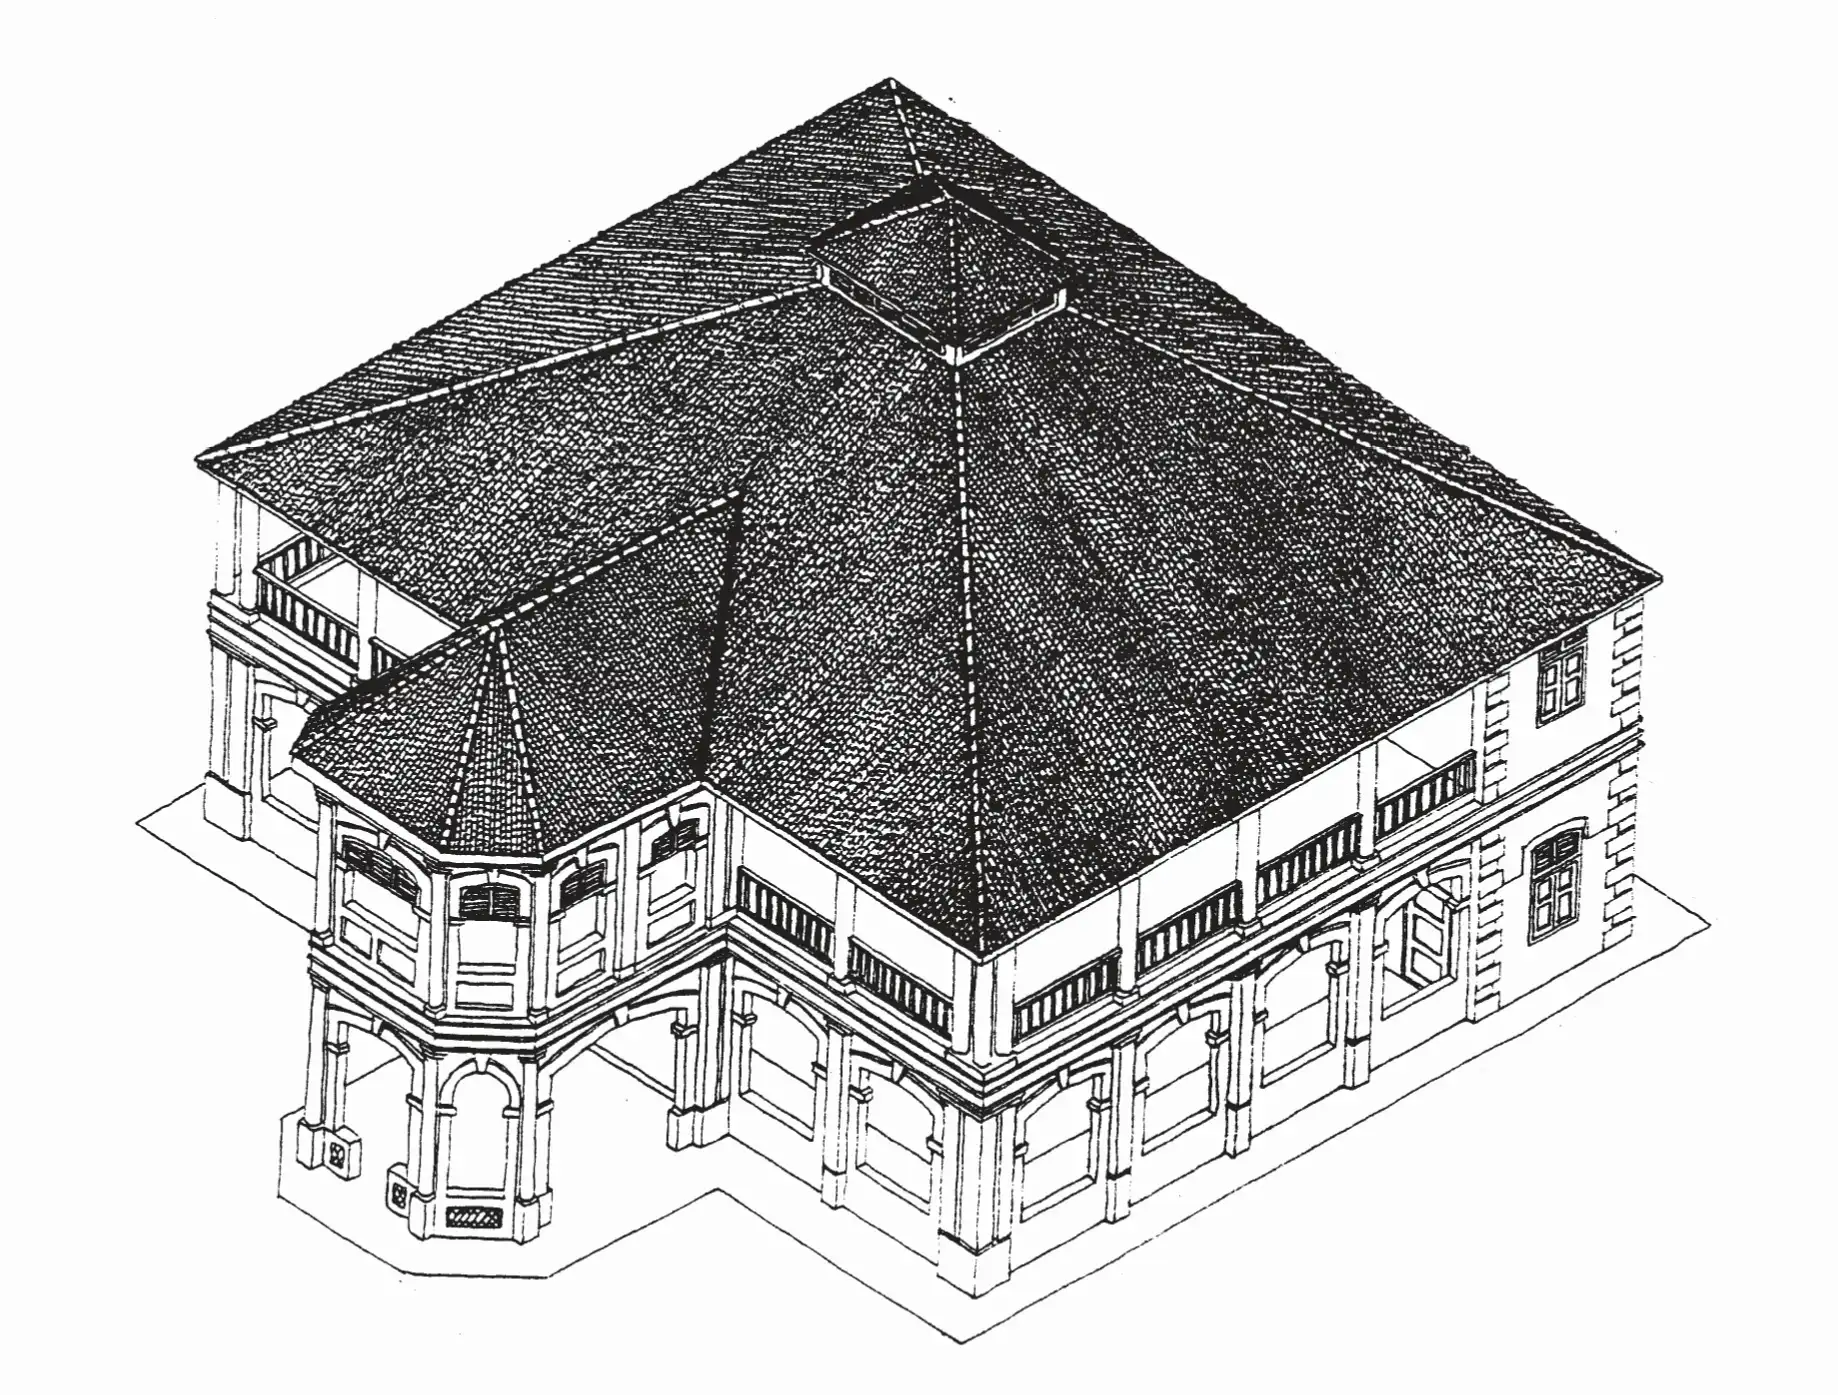
This private residential tower is elevated above street level by design for enhanced privacy and tranquillity, reminiscent of the early East Coast villas that were built on raised columns.
Located in the East Coast, Amber House sits along Amber Gardens, a neighbourhood of relaxing charm infused with modern amenities.
Carrying the essence of tropical rusticity, Amber House offers a retreat from the urban landscape, where home is forevermore an exclusive, peaceful retreat.
A Gem of a Place Radiating with Vivacity
The East Coast is a timeless and treasured tapestry of life and leisure, always full of energy, warmth, and charm. It is where vibrant moments unfold, and cherished memories are made.
Indulge in rich flavours and charming cafés at Katong–Joo Chiat.
Pick up groceries conveniently at Katong V.
Commune and Unwind in the Upper Grounds
The Upper Grounds, located on level 1, is designed to elevate everyday moments with family-friendly facilities for residents to gather and entertain. The function rooms are generous in size and can be used together for larger events or separately for more intimate occasions.
Living Room and Dining Room @ Upper Grounds
Illuminating Moments in the Sky Verandah
The Sky Verandah is a tranquil space ideal for a refreshing swim in the 35m Lap Pool, an impromptu workout in the Fitness Room, or an intimate gathering at the Sky Pavilion.
35m Lap Pool @ Sky Verandah. Fitness Room @ Sky Verandah
Enquire About This Development
Request the latest pricing and availability, arrange a viewing or get help comparing this development with other projects.
Share your contact details below and we’ll get in touch to discuss your enquiry. No obligation to proceed.
Other Topics That May Interest You
Unit Types & Indicative Prices
Areas shown are harmonised.
Unit Type
Size (sq ft)
Indicative Price
2 Bedroom
635 (15 Units)
From S$2,100,280
2 Bedroom + Study
732 to 753 (30 Units)
100% Sold
3 Bedroom
980 (15 Units)
From S$3,083,350
3 Bedroom + Study
1216 (15 Units)
From S$3,725,722
3 Bedroom Premium
1238 (15 Units)
100% Sold
4 Bedroom Premium
1744(15 Units)
From S$5,327,451
Indicative prices are subject to change and unit availability.
Contact us for the latest pricing and available units.
AMBER HOUSE Sales and Rental Transactions
Share a link to the applied filters and selected section. Figures update over time.
Property market snapshot
Prices, rents and activity
Oct 2025 – Sep 2026
Size and bedroom options show recorded transactions in the selected period; they do not describe every unit type in the development. The period ends before the current month. Sales filters apply to sales; bedroom selection applies to rentals. The same filters apply to the figures, charts and transaction tables below.
AMBER HOUSE · Oct 2025 – Sep 2026 The imported URA data contains 31 sales and 0 rental contracts matching the selected period and filters.
Median single-unit sale price: S$3,550,510, based on 31 sales. Median strata sale price per square foot: S$3,116 / sqft, based on 31 sales. No qualifying monthly rents are available in this view.
Sale type: All sale types. Sales unit size: All unit sizes. Rental bedrooms: All bedroom counts. Historical transactions describe this sample, not current asking prices, rental listings or a valuation.
Median sale priceS$3,550,51031 single-unit sales · All sale types
Median sale PSFS$3,116 / sqft31 strata sales · All sale types
Median monthly rent—0 rental contracts
Recorded activity31 sale records0 rental contracts · selected period
The sale cards combine sale types. Choose New Sale, Sub Sale or Resale for a focused comparison; the size breakdown keeps those types separate.
Sale prices by unit size
Median transaction price; sale types shown separately. Bars share a zero-based scale within this panel. Select a size label to filter sales.
Median monthly rent. Bars share a zero-based scale within this panel. Select a bedroom label to filter rentals.
No qualifying rental contracts in this view. Try a longer period or another bedroom selection; older configurations remain excluded.
How to read these figures
Medians describe the transactions in this view, not a valuation or a change in every home’s value. Middle 50% is the 25th–75th percentile, shown only with at least five observations; smaller groups are flagged. Minima and maxima are available in the breakdown tables. Percentiles use linear interpolation.
Price and PSF statistics include only sales explicitly recorded as one unit. Bulk sales and records with an unknown unit count remain in the detailed table when All unit sizes is selected. PSF uses unrounded strata area; size bands use rounded square feet. A size band does not identify bedrooms, penthouses, layout or unit condition.
Rental bedrooms are as reported; missing or non-numeric values are Not stated. Rental sizes are ranges. Rents and sales are separate samples: no project yield or exact rental PSF is inferred.
Discuss this property
Get a price or rental assessment
Request an assessment for your home or discuss rental potential based on comparable transactions.
AMBER HOUSE · Oct 2025 – Sep 2026 · All sale types · All unit sizes · All bedroom counts
Your enquiry will include the property, page URL and transaction filters shown above. Yield-calculator amounts are excluded.
Test your assumptions
Rental yield calculator
Enter a purchase price and monthly rent for the same home. Results update as you type. Your assumptions stay in this page while you change transaction filters; they are not submitted or saved.
No qualifying rent observations in the selected view. Enter your own rent assumption; no rent is inferred from older configurations.
Optional vacancy and running expenses
Blank expense fields count as zero. Enter annual costs for the full year; they are not reduced during vacancy.
Enter purchase price and monthly rent to calculate.
Annual income after entered expenses = monthly rent × (12 − vacant months) − monthly maintenance × 12 − annual property tax − other annual running costs. Yield after entered expenses divides that income by purchase price.
Results use your assumptions and are indicative, before financing and personal income tax. The denominator excludes stamp duties, legal fees, renovation, furnishing and other acquisition costs. Include recurring insurance, repairs and letting costs in other running costs where relevant. No appreciation, mortgage repayment or return on equity is calculated. Historical rental contracts do not guarantee future rent or occupancy.
History and activity
How transactions changed over time
Monthly · Oct 2025 – Sep 2026
The active filters also apply here. Value axes start at zero and adjust to the selected records; check their labels when comparing views. Each point shows a period median; the bars below count recorded sales or rental contracts. Different sale types and rental bedroom counts have separate series. These changes can reflect the mix of homes transacted, rather than appreciation of an individual home.
Sale PSF history
Median S$/sqft for single-unit strata sales, by sale type.
New Sale
On a narrow screen, swipe the chart horizontally. Tap a point/bar or use the period controls for exact figures.
Aug 2026
1 sale records in this period.
New Sale: S$3,125 / sqft · 1 sale · limited sample
Exact history and activity table
Period
New Sale median PSF
New Sale sales
Sale records
Oct 2025
S$3,036
4 (limited)
4
Nov 2025
S$3,135
4 (limited)
4
Dec 2025
S$3,028
2 (limited)
2
Jan 2026
S$3,174
5
5
Feb 2026
S$3,106
5
5
Mar 2026
S$3,194
2 (limited)
2
Apr 2026
S$3,091
1 (limited)
1
May 2026
S$3,162
2 (limited)
2
Jun 2026
S$3,081
1 (limited)
1
Jul 2026
S$3,226
4 (limited)
4
Aug 2026
S$3,125
1 (limited)
1
Sep 2026
—
0
0
Monthly rent history
Median monthly rent in S$, by reported bedroom count.
No qualifying rental contracts in this period and filter selection. Existing rental-configuration boundaries remain applied.
Filled points have at least five qualifying observations; hollow points have fewer than five. Lines join only adjacent filled points. Gaps are not estimated or filled with zeros. For five-year views, edge quarters marked * may contain fewer than three selected months. Sale activity bars include all selected sale records; PSF points use only qualifying single-unit strata sales.
Individual sale comparison
Sale price versus unit size
Oct 2025 – Sep 2026 · 31 qualifying sale records. The period, sale-type and unit-size filters above apply. Bedroom filters affect rentals only
Each plotted position represents one or more sales at that size and price. Tap a marker or select a record below for its contract month, floor range and PSF. Markers with a number contain multiple records; none are discarded.
New Sale
Both axes start at zero and adjust to the selected sales. All qualifying sales, including extreme values, remain shown. Swipe horizontally on a narrow screen. Identical positions are grouped without moving the data points. Nearby markers can overlap; the selector and table retain every eligible record.
#1 · Aug 2026 · New Sale · 1,744 sqft · S$5,449,928 · floor 06-10
S$3,125 / sqft
Exact plotted sales table
Record
Contract month
Sale type
Floor range
Size (sqft)
Price (S$)
PSF (S$/sqft)
1
Aug 2026
New Sale
06-10
1,744
5,449,928
3,125
2
Jul 2026
New Sale
06-10
635
2,057,670
3,240
3
Jul 2026
New Sale
01-05
980
3,074,310
3,139
4
Jul 2026
New Sale
16-20
980
3,228,840
3,296
5
Jul 2026
New Sale
16-20
1,216
3,907,530
3,213
6
Jun 2026
New Sale
11-15
1,216
3,747,438
3,081
7
May 2026
New Sale
11-15
980
3,156,118
3,222
8
May 2026
New Sale
11-15
1,744
5,408,000
3,101
9
Apr 2026
New Sale
11-15
1,216
3,760,240
3,091
10
Mar 2026
New Sale
11-15
635
2,078,061
3,272
11
Mar 2026
New Sale
01-05
980
3,052,522
3,116
12
Feb 2026
New Sale
11-15
980
3,108,424
3,173
13
Feb 2026
New Sale
16-20
1,744
5,398,557
3,096
14
Feb 2026
New Sale
06-10
980
3,042,512
3,106
15
Feb 2026
New Sale
01-05
1,238
3,784,000
3,057
16
Feb 2026
New Sale
11-15
980
3,168,400
3,235
17
Jan 2026
New Sale
11-15
980
3,109,206
3,174
18
Jan 2026
New Sale
01-05
1,216
3,550,510
2,919
19
Jan 2026
New Sale
11-15
635
2,078,384
3,273
20
Jan 2026
New Sale
16-20
1,238
3,983,000
3,218
21
Jan 2026
New Sale
11-15
1,216
3,732,474
3,069
22
Dec 2025
New Sale
11-15
1,216
3,762,402
3,093
23
Dec 2025
New Sale
06-10
1,216
3,602,895
2,962
24
Nov 2025
New Sale
11-15
1,238
3,914,652
3,162
25
Nov 2025
New Sale
11-15
635
2,000,274
3,150
26
Nov 2025
New Sale
01-05
1,216
3,565,302
2,931
27
Nov 2025
New Sale
06-10
635
1,981,338
3,120
28
Oct 2025
New Sale
01-05
635
1,943,084
3,060
29
Oct 2025
New Sale
01-05
1,238
3,713,050
3,000
30
Oct 2025
New Sale
06-10
980
3,002,088
3,065
31
Oct 2025
New Sale
01-05
1,238
3,728,100
3,012
0 selected records excluded from this plot: only explicitly single-unit strata sales with positive numeric prices and areas qualify. Size positions and PSF use unrounded area; displayed sizes are rounded. Record numbers refer to this view and are not unit identifiers. No fitted price or valuation is inferred.
Sales Transactions
Contract month
Type of sale
Floor range
Area (sqft)
Sale price (S$)
Price (S$/sqft)
Units in transaction
Mar 2026
New Sale
01-05
980
3,052,522
3,116
1
Feb 2026
New Sale
11-15
980
3,108,424
3,173
1
Feb 2026
New Sale
16-20
1,744
5,398,557
3,096
1
Feb 2026
New Sale
06-10
980
3,042,512
3,106
1
Feb 2026
New Sale
01-05
1,238
3,784,000
3,057
1
Feb 2026
New Sale
11-15
980
3,168,400
3,235
1
Jan 2026
New Sale
11-15
980
3,109,206
3,174
1
Jan 2026
New Sale
01-05
1,216
3,550,510
2,919
1
Jan 2026
New Sale
11-15
635
2,078,384
3,273
1
Jan 2026
New Sale
16-20
1,238
3,983,000
3,218
1
Last downloaded: 29 Oct 2026, 12:19 SGT. 31 matching records in the selected period.
Rental Contracts
No matching records in the selected period and filters.
Source: Urban Redevelopment Authority (URA), accessed through the URA Data Service. Data made available under the Singapore Open Data Licence. Areas are rounded; rental areas are ranges. Records may be revised and do not identify exact units. Multiple transactions in the same month are not ordered by day. These records are historical transactions, not current listings or valuations.
Amber House: Location & Nearby
Explore nearby transport, selected schools, supermarkets, food centres, recreation, shopping destinations and selected hotels. Select a place to see its location or an estimated walking or public transport route.
Nearby amenities at a glance
Selected places near Amber House. Distances are approximate straight-line distances from the nearest reviewed development gate to saved map points, not walking distances or times. Gate access restrictions may apply. School points represent campuses; distances are not for Primary 1 admission.
Use the map below to select gates, review entrance choices and request walking or public transport directions. This overview lists the saved selections; map filters do not change it. Sources and data dates are listed below.
Selected schools; this list is not exhaustive. Gate-to-point distances are for orientation, not P1 admission.
Calculating walking route…
List distances are straight-line estimates. Walking routes start at the named gate and exclude walking within the development or indoors. Mapped shop and food-centre points may differ from entrances. Park walks use a map reference point unless an entrance has been reviewed. Check access restrictions, opening hours and temporary closures; routes do not confirm sheltered or step-free access. Public transport estimates include buses and MRT/LRT, use current services and include walking and waiting; they are not live bus arrivals. Walking sections are dashed, bus routes are blue and rail routes are purple. School distances are not for P1 admission. Lists and source coverage may be incomplete.
Selected schools use reviewed campus and entrance records shared across this website. Source: MOE via data.gov.sg and OneMap, supplemented where needed by official school website addresses. School entrances may be for school users or authorised visitors only; check the selected entrance’s access note.
Primary 1 admission: Gate-to-point and walking distances do not determine the official home-school distance category or admission eligibility. Check your exact residential address using OneMap School Query and MOE’s guidance.
Food & Markets: NEA via data.gov.sg; retrieved 29 Oct 2026. See the source for its coverage period. Singapore Open Data Licence. Covers NEA-listed centres and selected supplementary food locations, not all restaurants, coffee shops or private food courts.
Parks & Recreation: NParks park points and SportSG facilities, via data.gov.sg, retrieved 29 Oct 2026. Singapore Open Data Licence. Park reference points are not entrances or nearest boundaries; large parks may have nearer entrances outside the source-point search. SportSG coverage excludes Dual Use Scheme venues. Selected attractions and museums use separately sourced official addresses, matched by exact postal code through OneMap; these are not part of the NParks / SportSG datasets. Check operator access, fees, bookings, current opening status and source coverage dates.