
Sol Acres vs Palm Gardens: A Decade of Property Price & Rental Trends (2015–2025)
This report is the seventh installment in our ongoing series examining how new launches perform over time, benchmarked against Palm Gardens.
Over the past decade, Singapore’s residential market has undergone notable shifts in both sale prices and rental rates. In this edition, we focus on Sol Acres—one of the largest executive condominiums (ECs) in Choa Chu Kang, which attained its Minimum Occupation Period (MOP) in 2023—and compare it with Palm Gardens, a nearby 99-year leasehold private condominium completed in 2000.
Our analysis tracks how sale prices and rental yields for both developments evolved from 2015 to 2025, segmented by unit type (1-bedroom, 2-bedroom, 3-bedroom, and 4-bedroom+). By evaluating the post-MOP performance of a newer EC against the long-term trajectory of an older condo, buyers and investors can better understand typical EC value appreciation, rental demand patterns, and how these factors correlate over time.

Project Comparison Background
Sol Acres (TOP 2018) is one of the largest ECs in Singapore, with 1,327 units across 13 blocks. It was launched in 2015 at relatively affordable prices (averaging ~$787 per square foot, psf), partly due to EC purchase subsidies and income eligibility conditions. Unique for an EC, Sol Acres includes 1-bedroom units (typically, ECs built before 2015 did not offer such small units). The project is located along Choa Chu Kang Grove, served by Keat Hong and Teck Whye LRT stations, and became eligible for open-market resale and full-unit rentals upon reaching its 5-year MOP in 2023.
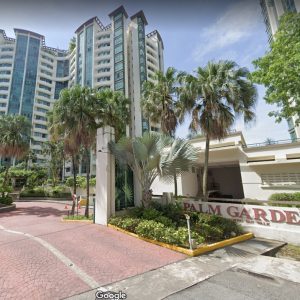
Palm Gardens (TOP 2000) is a nearby 99-year leasehold private condominium at Hong San Walk (District 23). It comprises 694 units spread across several blocks, with unit types ranging from 2- to 4-bedrooms (no one-bedroom units). By 2015, Palm Gardens was a mature development with around 15 years of age; as of 2025, it has around 70 years of lease remaining. Located within walking distance of Keat Hong LRT and a short ride from Choa Chu Kang MRT/Lot One Mall, Palm Gardens offers a useful performance benchmark as a comparable mass-market condo in the same area (though older and fully privatised).
Market Context (2015–2025): This decade spans cycles of cooling measures and a recent surge post-2020. From 2015 to ~2017, Singapore’s resale condo prices were relatively flat amid property curbs. A modest uptick occurred from 2018–2019, followed by a pandemic-era boom (2021–2023) that saw sharp increases in both resale values and rents islandwide. Sol Acres, launched during a subdued market and entering the resale market during a boom, was primed for strong appreciation. Palm Gardens, with its older age and steady resale presence, provides a contrast in how a more “steady state” 99-year condo has fared over the same timeframe.
Below, we delve into sale price trends by bedroom type, then rental trends, followed by an analysis of rental yields from 2023–2025 (crucial since Sol Acres could only be rented out after 2023). We then discuss how these trends correlate and what they imply about ECs post-MOP, compared to a conventional condo.
Sale Price Analysis by Bedroom Type
Understanding sale price trends by unit type helps reveal which segments drove value gains. We analyse the annual average sale price per square foot (psf) from 2015 to 2025 for 1-bedroom, 2-bedroom, 3-bedroom, and 4-bedroom+ units in Sol Acres, and compare them with Palm Gardens for the corresponding types (except 1BR, which Palm Gardens lacks). The charts below illustrate these trends showing 2024/2025 outcomes, along with total percentage gains.
One-Bedroom Units (Sale) (Sol Acres only)

Sol Acres’ 1-bedroom apartments (about 495–646 sq ft) have seen a dramatic climb in resale values. When first sold in 2015–2016 (developer sales), prices averaged around $790 psf – roughly $420k for a 1BR unit. By 2025, after MOP and entry into the open market, 1-bedroom units command about $1,540–$1,550 psf, translating to resale prices around $800k. This nearly doubles the psf price (+95% from 2016 to 2025). The chart above shows Sol Acres’ 1BR trend line shooting upward, reflecting how the EC “privatisation” effect and overall market momentum have unlocked significant appreciation. Transaction volume also grew in 2023 after MOP, indicating healthy demand for these compact units once they became available on the resale market. (Palm Gardens does not have 1-bedroom units, so no comparison line is present for Palm Gardens in the figure.)
2-Bedroom Units (Sale)

The 2-bedroom units form a common benchmark for both projects. In Sol Acres, 2BR flats (~700–800+ sq ft) launched around $800 psf in 2015. Early buyers paid roughly $580k–$650k for a 2-bedroom EC then. By 2025, Sol Acres’ 2BR units are averaging about $1,500 psf (around $1.0–$1.2 million per unit), a striking increase of roughly 85–88% in psf terms. In contrast, Palm Gardens’ 2-bedroom units (958–980 sq ft, typical) were transacting in the mid-$700s psf in 2015 and have risen to approximately $1,000–$1,050 psf by 2024. This is a respectable gain of roughly 27% over ten years, but notably more modest than Sol Acres’ leap. By 2025, Sol Acres 2BRs sell at a ~58–61% higher psf than comparable Palm Gardens units, reflecting the premium buyers are willing to pay for a newer (2018-built) property. We also see far higher sales turnover for Sol Acres 2BRs (the EC had 514 total 2BR transactions in the period) compared to Palm Gardens (fewer than 30 recorded sales for 2BR in the last decade), likely because many Sol Acres owners sold post-MOP. In contrast, Palm Gardens had a more limited supply of 2BR units and a longer-settled ownership base.
3-Bedroom Units (Sale)

3-bedroom units are typically family-sized and make up the bulk of both developments (Sol Acres has 668 3BR units). The sale price trends for 3BRs show Sol Acres starting around $780 psf in 2015 and climbing to about $1,460 psf in 2025. That’s an 86% jump (from roughly $780k for a 1,000 sq ft 3BR at launch to $1.46 million by 2025). Palm Gardens’ 3-bedroom units (which are larger, ~1,200+ sq ft) went from about $710 psf in 2015 to $1,070 psf in 2025, roughly a 50% increase over the decade. In absolute terms, Palm Gardens 3BR prices moved from the high $800-thousands in 2015 to ~$1.2–$1.3 million in recent transactions. Notably, Sol Acres’ 3BR prices surpassed Palm Gardens’ on a psf basis sometime post-2020 and maintained a lead – by 2025, a Sol Acres 3BR is ~$1.46k psf vs Palm Gardens ~$1.07k psf. This underscores how a new EC, once fully privatised, can appreciate to equal or even exceed older 99-year private condos in the vicinity. High volumes were observed for Sol Acres 3BR sales (many original owners capitalising on gains post-MOP). In contrast, Palm Gardens saw steadier, lower transaction counts (e.g. ~200 total 3BR sales over the decade, reflecting gradual resales).
4-Bedroom and Larger Units (Sale)

Larger units (4-bedrooms and above) in Sol Acres (including 5BR units) also exhibited strong appreciation. The Sol Acres 4BR average rose from about $788 psf in 2015 to roughly $1,480 psf in 2025, an increase of ~88%. In dollar terms, a ~1,200 sq ft 4-bedroom that cost ~$950k at launch might resell for around $1.7–$1.8 million today. Palm Gardens’ 4-bedroom units (very spacious at 1,432–2,300+ sq ft) moved from around $720 psf in 2015 to $1,110 psf by 2025, an increase of about 55%. Because Palm Gardens’ 4BRs are larger, their total prices went from roughly $1.0–$1.1M (2015) to $1.6–$1.8M (2025) on average – similar quantum prices as Sol Acres, though Sol’s psf is higher. The gap in psf between Sol Acres (~$1.48k) and Palm Gardens (~$1.11k) for big units is smaller in percentage terms than for smaller units, possibly because larger units attract more owner-occupiers than investors, and older 4BRs still appeal for their space. Both projects showed profitable outcomes in the charts, indicating that current prices are well above initial prices. Overall, Sol Acres’ larger units benefited from the EC uplift and strong upgraders’ demand. At the same time, Palm Gardens’ appreciation was steady but limited by its ageing lease and competition from newer offerings.
Summary of 10-Year Sale Price Changes (2015–2025):
| Unit Type | Sol Acres 2015 PSF→ 2025 PSF | Absolute Change | % Change | Palm Gardens 2015 PSF→ 2025 PSF | Absolute Change | % Change |
| 1-BR | ~$794 psf (2016)→ ~$1,547 psf | +753 psf | +95% | NA | NA | NA |
| 2-BR | ~$800 psf → ~$1,502 psf | +$702 psf | +85% | ~$800 psf → ~$1,028 psf | +$228 psf | +27% |
| 3-BR | ~$784 psf → ~$1,461 psf | +$677 psf | +86% | ~$713 psf → ~$1,068 psf | +$355 psf | +50% |
| 4-BR | ~$788 psf → ~$1479 psf | +$691 psf | +88% | ~$719 psf → ~$1,113 psf | +$394 psf | +55% |
As the above figures show, Sol Acres dramatically outperformed Palm Gardens in capital appreciation across all unit types. Much of Sol Acres’ growth came in 2023, especially once the EC hit MOP. In contrast, Palm Gardens, lacking such a catalyst and being older, saw a more modest upward trajectory aligned with the broader market. By 2025, Sol Acres units are transacting at significantly higher psf prices than Palm Gardens across all categories, reflecting the “newer EC premium”. However, Palm Gardens achieved decent gains given its age, illustrating that well-located 99-year condos can still appreciate, though not at the explosive rate of a new EC transitioning to full market status.
Rental Price Analysis by Bedroom Type
Next, we compare rental rate trends for Sol Acres and Palm Gardens by bedroom type. Rental data is examined from around 2018–2021 up to 2025 (with Sol Acres rentals only meaningfully appearing after 2019, when the project was completed, and especially after 2023 post-MOP, when owners could rent out whole units). We look at the average monthly rent in \$ per square foot (\$ psf per month) for each unit type, which accounts for unit size differences. These trends highlight how each project fared in the rental market, and they inform the rental yield discussion later. Generally, Singapore saw a surge in rents from 2021 to 2023 due to tight supply and high housing demand – our analysis will show how that played out between new and older developments.
One-Bedroom Units (Rentals)

For 1-bedroom rentals, only Sol Acres provides usable data, as Palm Gardens has none. Sol Acres’ 1-bedroom flats entered the rental market gradually after the project’s TOP (~2018) and more meaningfully from 2023 onward, with early leases requiring special HDB approval. Even though the initial transaction volume was low, these early rentals still offer a reasonable benchmark for market rates.
In 2021, the average rent for a 1BR unit at Sol Acres was about $4.00 psf per month (roughly $1,800 for a ~450 sq ft unit). By 2025, rents had risen to around $5.75 psf (approximately $2,800–$3,000 per month), representing a substantial 44% increase over four years. Rents reached a high of approximately $6.00 psf in late 2023 before settling back to about $5.75 by 2025.
As more owners began leasing out their 1BR units post-MOP, rental transaction volumes surged—from virtually zero before 2023 to dozens of contracts per year by 2025, as reflected in the chart. The steep rent growth highlights both the premium commanded by newer, compact units and the ability of EC owners to benefit from the buoyant rental market once they are eligible to rent out their homes.
Two-Bedroom Units (Rentals)

The 2-bedroom rental trends show a distinct contrast between the newer EC and the older condominium. In 2021, Sol Acres’ 2BR units rented for about $3.26 psf (roughly $2,500 per month for ~760 sq ft), whereas Palm Gardens’ 2BR units averaged only $2.18 psf (around $2,100 per month for ~960 sq ft). Although Palm Gardens often achieved rents similar to or slightly higher than those of its peers due to its larger unit sizes, its psf rate remained much lower—a reflection of the development’s age and design. As with the 1-bedroom units, most 2021–2022 rental contracts were early leases requiring HDB approval, with rental activity rising sharply only after Sol Acres reached MOP in 2023.
By 2025, Sol Acres’ 2BR rents had increased to around $4.50 psf (approximately $3,500 per month), marking a 38% rise from 2021. Palm Gardens experienced even stronger growth: its 2BR rents climbed to about $3.42 psf (around $3,300 per month for ~960 sq ft), representing a 57% increase from its low starting point. Although both projects saw a similar absolute rent uplift (~$1.24 psf), Palm Gardens’ lower baseline made its percentage gain appear more dramatic.
Despite this catch-up, Sol Acres continued to command slightly higher rents in 2025, supported by its newer facilities and modern design. Tenants could expect to pay around $3.2k–$3.6k per month for a 2BR at Sol Acres, compared to roughly $3.2k–$3.4k at Palm Gardens. While the post–COVID-19 period saw tenants leaning toward larger units, Sol Acres benefited from its open-concept layout, which makes its slightly smaller units feel more spacious.
Three-Bedroom Units (Rentals)

The 3-bedroom rental trend for Sol Acres mirrors those of the 1- and 2-bedroom segments, except for a single 3BR rental recorded in 2018. Because this outlier room rental, which distorts the data, 2021 serves as the more reliable baseline—similar to the other unit types—when early leases were allowed with HDB approval before the 2023 MOP.

In 2021, Palm Gardens’ 3BR units rented for around $2.04 psf, rising to approximately $2.96 psf by 2025 (about $3,800–$4,000 per month). This represents a solid +45% increase over four years. Sol Acres’ 3BR units, by contrast, commanded about $2.72 psf in 2021 (roughly $2,800 per month for a 1,000 sq ft unit), reflecting tenants’ willingness to pay a premium for a newer development. By 2025, Sol Acres’ 3BR rents increased to around $3.90 psf, having peaked at roughly $4.19 psf in 2023 before moderating.
While both projects saw similar percentage growth, the key takeaway is that Sol Acres consistently achieved higher rental psf for 3BR units than Palm Gardens, due to its newer age, modern layout, and upgraded amenities. As with the 2-bedroom units, post–COVID-19 preferences shifted toward larger homes, and Sol Acres benefited from its open-concept living, dining, and kitchen layout, which makes its units feel more spacious despite having a slightly smaller footprint.
Four-Bedroom Units (Rentals)

The 4-bedroom and larger-format rental segment is smaller in volume but still provides meaningful insights. Sol Acres’ 4BR units (including a handful of larger 5BR layouts) began renting around 2022 at approximately $3.00 psf (about $3,700 per month for ~1,250+ sq ft). By 2025, rents had increased to around $3.67 psf, representing a 22% rise.
Palm Gardens’ 4BR units, on the other hand, were renting at roughly $2.50 psf in 2021 and climbed to about $2.90 psf by 2025—a more modest 16% increase. In absolute rent terms, a typical 1,500 sq ft Palm Gardens 4BR would rent for around $3,900/month in 2025, up from about $3,300 in 2021. Meanwhile, a 1,250 sq ft 4BR at Sol Acres would fetch around $4,500/month at roughly $3.60 psf.
Overall, larger units experienced the lowest rent growth, likely because their starting rent levels were already high and the tenant pool for big-format apartments is smaller. Nonetheless, consistent with all other unit categories, the newer Sol Acres continues to command a psf rental premium over Palm Gardens in this segment.
Summary of Rental Rate Changes (approx. 2021–2025):
| Unit Type | Sol Acres Rent 2021 → 2025 ($ psf/month) | Absolute Change | % Change | Palm Gardens Rent 2021 → 2025 ($ psf/month) | Absolute Change | % Change |
| 1-BR | $4.00 → ~$5.75 | +$1.75 | +44% | NA | NA | NA |
| 2-BR | $3.26 → $4.50 | +$1.24 | +38% | $2.18 → $3.42 | +$1.24 | +57% |
| 3-BR | $2.72 → $3.90 | +$1.18 | +44% | $2.04 → $2.96 | +$0.92 | +45% |
| 4-BR | $3.00 → ~$3.36 | +$0.36 | +12% | ~$2.54 → ~$2.94 | +$0.40 | +16% |
Across all unit types, both developments saw strong rental growth through the early to mid-2020s—particularly for the smaller units—in line with broader market trends. Palm Gardens’ 2-bedroom units recorded the largest percentage increases, thanks to their lower starting rents. Sol Acres, being a newer development, already commanded higher baseline rents, resulting in more modest percentage growth, though the absolute rent increases were still substantial.
One notable exception was the 4-bedroom segment, where rent growth lagged behind the smaller unit types. This suggests weaker demand for large-format units in the area, likely due to a smaller tenant pool and higher monthly rent commitments associated with these units.
Rental Yield Insights (2023–2025)
With both sale and rental figures established, we can now examine rental yields—the annual rental return relative to a property’s market value—for each project during the period after Sol Acres reached MOP (2023–2025). Rental yield is calculated as (Monthly Rent × 12) ÷ Sale Price, expressed as a percentage. This metric helps investors and homeowners assess how efficiently their property investment is performing and provides insight into the relative market value of each development.
For this analysis, we use 2023 and 2025 sale prices and rents by unit type as a proxy for current yields and review how these yields have trended from 2023 to 2025.
Estimated Gross Rental Yields (2023-2025):
| Unit Type | Sol Acres(2023) | Sol Acres (2025) | Palm Gardens (2023) | Palm Gardens (2024/2025) |
| 1-BR | ~5.1% ($1414psf, $6.08psf/pm) | ~4.46% ($1547psf, $5.75psf/pm) | NA | MA |
| 2-BR | ~2.91%($1343psf, $3.26psf/pm) | ~3.6%($1502psf, $4.5psf/pm) | ~2.62%($999psf, $2.18psf/pm) | ~4%($1028psf, $3.42psf/pm) |
| 3-BR | ~3.7%($1351psf, $4.19psf/pm) | ~3.2($1461psf, $3.90psf/pm) | ~3.58%($1016psf, $3.03psf/pm) | ~3.33%($1068psf, $2.96psf/pm) |
| 4-BR | ~3.13%($1402psf, $3.66psf/pm) | ~2.72%($1479psf, $3.36psf/pm) | ~3.37%($1014psf, $2.85psf/pm) | ~3.17%($1113psf, $2.94psf/pm) |
Table: Approximate gross rental yields from 2023-2025, based on average rents and resale prices.
As shown above, smaller units generally yield higher percentages. Sol Acres’ 1BR apartments have an estimated ~4.5% yield in 2025 – the highest among its unit types – thanks to relatively strong rents (~$2.8k/month) against a resale value of ~$800k+. For 2BR units, Palm Gardens actually edges out Sol Acres in yield (~4.0% vs ~3.6%), despite lower rent, because Palm’s resale prices are much lower. This highlights how older properties with depressed values can show higher yield, even if their rents are lower, simply because of the smaller denominator (price). For 3BR and 4BR units, yields for Sol Acres and Palm Gardens are pretty similar (~3.0–3.4%), indicating that by 2025 the market has equilibrated the return on these family-sized homes: Sol Acres fetches higher rent but also costs more, while Palm Gardens is cheaper to buy but gets a bit less rent.
Trend from 2023 to 2025: Right after MOP in 2023, Sol Acres units likely had slightly higher yields, since resale prices were still catching up while rents spiked. For example, many Sol Acres 3BR units sold in 2023 around ~$1.2k psf (before the full post-MOP price run-up), yet they could rent for ~$3.8 psf – yielding around 3.8–4%. By 2025, however, Sol Acres resale prices had risen further (to ~$1.45k psf for 3BR), compressing yields back to ~3.3%. In essence, rents and resale values rose in tandem, keeping yields in a fairly typical range. The rental yield for Sol Acres 1BR might have been extraordinarily high for original owners (who paid ~$400k and now rent at ~$3k/month, a yield ~9% on cost!), but for a new buyer at $800k, the yield is ~4.5%. This distinction underscores a point: EC buyers who got in at launch benefit doubly – first from capital appreciation, then from high yield on their initial cost if they lease out – whereas buyers post-MOP face market-normalised yields.
Palm Gardens’ yield trend has likely improved over the decade: in 2015, yields were probably ~2-3% (low rents and stagnant prices). By 2025, thanks to the rental surge, yields are ~3-4%, making the ageing property somewhat more attractive to investors than before. However, lease decay will eventually put downward pressure on values (and possibly rents as the property ages further), so it’s a balancing act.
In summary, Sol Acres’ rental yields from 2023–2025 have been healthy (around 3–4%), but not outlandishly high, and have converged with broader market norms for mass-market condos. The act of achieving MOP did not produce abnormal yields; instead, it unlocked the ability for owners to earn rental income, which many did. However, the influx of new rentals was met by strong tenant demand during the period. The result is that both Sol Acres and Palm Gardens offered comparable rental returns by 2025, with Sol’s modern appeal counterbalanced by Palm’s lower entry price.
Correlation & Market Implications
Correlation of Sale and Rental Trends: Both sale prices and rentals in Sol Acres and Palm Gardens have risen significantly over the last 10 years, especially since 2020. However, the drivers and timing of these increases had some differences: – For Sol Acres, the major inflexion point for sale prices was around the MOP in 2023. Before that, Sol Acres’ resale market was limited (only exceptional cases), and its values, while creeping up with the general market, remained below full private condo levels. Once MOP hit, a wave of units entered the resale market at prices that “reset” significantly higher, closing the gap with private condos. This is typical EC behaviour: pent-up resale demand and the lifted ownership restrictions result in a one-time jump in value. Not coincidentally, this period (2021–2023) was also when Singapore’s property market was bullish, amplifying the effect. On the rental side, Sol Acres similarly saw a significant change post-MOP – dozens of units were rented out where none had been available previously. Despite this surge in supply, rents held firm or rose, indicating that tenant demand was sufficient to absorb the new EC units, aided by the then generally tight rental market. – For Palm Gardens, changes in sale and rental prices were more gradual and correlated to overall market cycles. There was no singular event like an MOP; instead, Palm Gardens’ sale prices rose along with broader suburban condo prices. Interestingly, rental rates in Palm Gardens accelerated sharply post-2020 (as did most older condos’ rents), even more so than their sale prices. This led to an improvement in rental yields over time. One can infer a mild inverse relationship here: Palm Gardens’ relatively slower capital appreciation (due to ageing and possibly less investor interest) meant its prices stayed moderate, so when rents spiked, yields increased and likely drew some attention back to the development as a value play.
When examining sale-rent correlations, in both projects, the rising rents did support rising resale prices to an extent (since higher potential rental income can entice investors and justify higher selling prices). Yet, the correlation isn’t one-to-one: – In Sol Acres, capital appreciation far outpaced rental growth in percentage terms for most unit types (e.g. 1BR sale +95% vs rent +44%). This is because a large part of the sale price growth was the EC’s structural revaluation post-MOP, rather than organic yield-driven growth. Essentially, buyers were willing to pay much more in 2023–2025 for Sol Acres due to its new private-condo status and comparables, not just because the rent was high. The yield actually compressed slightly as prices surged ahead of rents. – In Palm Gardens, rental growth outpaced sale growth for some types (2BR, 3BR), which had the effect of boosting yields. This suggests that Palm Gardens’ sale prices might have lagged fundamentals, possibly due to concerns about its age/lease. The strong rent surge could eventually put upward pressure on prices (as investors see a 4% yield opportunity, they might bid up prices until yield falls closer to market norms). Indeed, Palm Gardens’ prices did rise ~30-50%, but given rents rose ~20-60%, there’s a case that rental performance helped sustain its value even as the property aged.
Typical EC Post-MOP Performance: The findings for Sol Acres confirm the typical pattern observed with ECs:
Significant Capital Upside: Sol Acres’ first owners bought at ~$750–$800 psf and by a few years after MOP were selling at $1,400–$1,500+ psf, effectively realising private condo level prices. Nearly all resale transactions have been profitable, often with hundreds of thousands in gains. This mirrors other EC case studies – ECs often appreciate 20-30% at MOP and continue to climb if market conditions are strong. In Sol Acres’ case, the appreciation was on the higher end due to favourable timing (MOP during a market upswing) and perhaps the sheer scale of the development, which created many comparables and buzz.
Alignment with Mass-Market Condo Prices: By 2025, Sol Acres’ psf prices are comparable to, and in some cases higher than, those of similar-age mass-market 99-year condos. It has effectively “joined” the private market. Meanwhile, Palm Gardens, due to its age, has fallen further behind newer entrants in pricing. This is expected, as newer ECs-turned-private condos (like Sol Acres) often set new benchmarks in their locales, while older condos must compete by pricing in their age and remaining lease terms.
Rental Competitiveness: Post-MOP ECs, such as Sol Acres, also become a significant source of rental supply. The analysis shows Sol Acres was able to attract tenants at premium rents (comparable to new condos in the area). This dispels a concern some investors might have had that an EC flooded with units for rent might suffer a rental glut – at least in the strong rental market of 2023–25, demand was ample. For context, Palm Gardens had always had units on the rental market, but the addition of Sol Acres’ stock didn’t dampen rents; instead, both rose. This implies the overall housing demand in the area grew, and/or that Sol Acres drew tenants from a different segment willing to pay more for a new unit. In contrast, Palm Gardens continued serving the budget-conscious segment. In the long term, as more ECs in the area reach MOP, competition will increase, but Sol Acres’ success indicates a robust market.
Market Implications: For owners and investors:
Homeowners (Upgraders) who bought EC units like Sol Acres have seen their assets transform over 10 years – not just in paper value but also in market perception (from subsidised housing to in-demand private condos). This suggests ECs remain a powerful avenue for wealth accumulation for eligible buyers, albeit one must account for the 5-year MOP lock-in.
Investors/Buyers post-MOP eyeing resale ECs should note that by the time of MOP, much of the steep undervaluation has been corrected. At 2025 prices, Sol Acres’ yields and appreciation potential may look more similar to those of any other 7-year-old condo. The comparison with Palm Gardens shows that older condos can offer higher yields and lower prices, but with less upside.
New vs old trade-off: Sol Acres delivered high growth but from 2025 onwards might behave like a typical condo (moderate growth, market-driven), whereas Palm Gardens had slower past growth but could offer value if one is yield-focused and not averse to older properties.
Market Health: The parallel rise in rents and prices in 2021–2025 indicates a fundamentally demand-driven market – people were both buying homes and renting in large numbers. If either rents or resale prices had diverged (e.g., prices up but rents not), yields would sink or rise abnormally. That both increased in concert (with yields staying around 3-4%) suggests the market was balanced by investors’ arbitrage between renting and owning. The data imply that, in the long run, if Palm Gardens’ yield climbs too high, buyers will step in (raising sale prices), and if Sol Acres’ yield falls too low, rents or prices will adjust.
In conclusion, the 10-year performance review of Sol Acres versus Palm Gardens vividly illustrates the EC effect in action: Sol Acres experienced explosive sale price growth (doubling in psf for smaller units) and strong rental uptake post-MOP, aligning its profile with that of a private condo by 2025. Palm Gardens, while overshadowed in capital gains, showed steady appreciation and even benefited from the recent rental craze, achieving solid yields. For the average homebuyer or investor, these trends highlight that newer properties (especially ECs) can offer high growth. In contrast, older properties may offer better immediate yields – and balancing these factors is key in property decisions. The correlation between rental and sale markets in this case was generally positive: a rising tide lifted all boats, with the EC riding a faster current. As always, individual results will vary, but the Sol Acres vs. Palm Gardens comparison provides a concrete case study of how an EC transitions into the market and how it stacks up against a conventional condo in the same neighbourhood over a decade-long horizon.
Conclusion
Both Sol Acres and Palm Gardens have ultimately proven to be rewarding holdings from 2015 to 2025, albeit in different ways. Sol Acres, starting as an EC, delivered spectacular capital appreciation after its MOP, reflecting typical EC post-MOP behaviour and the strong market conditions. Palm Gardens, a mature condo, achieved moderate price growth while boosting rental income, maintaining its appeal as a high-yield option. Rental and sale price trajectories for the two projects have shown that while new ECs undergo a one-time leap and then normalise, older condos steadily climb and can become attractive yield plays when rents surge.
For prospective buyers in the Choa Chu Kang vicinity (or similar suburban areas), the lessons are clear: If your goal is capital growth, an EC like Sol Acres (if bought at launch or pre-MOP) can significantly outperform over 5-10 years, essentially catching up to newer private condos in value. On the other hand, if you prioritise rental returns or a lower entry price, an older condo like Palm Gardens can offer respectable yields, though with less dramatic upside. Importantly, the broader market context (policies, economic climate, rental demand) will heavily influence outcomes – Sol Acres benefited from favourable timing, and a unique rental market boom amplified Palm Gardens’ gains.
In sum, the decade-long comparison of these two 99-year projects paints a picture of Singapore’s mass-market residential segment: dynamic, sensitive to policy milestones (such as EC MOP), and ultimately guided by the fundamental forces of demand and supply in both the resale and rental markets. Whether you are a homeowner watching your asset appreciate or a landlord calculating yield, the story of Sol Acres vs. Palm Gardens offers valuable insights into what drives property performance and how different segments of the market can yield different rewards over time.
Article contributed by Jerry Wong.

Jerry Wong is a realtor at Propnex Realty, bringing a rich background in interior and lighting design to his work. He loves exploring diverse spaces and observing the transformative power of real estate. Beyond his professional role, Jerry finds his greatest fulfillment in connecting people with the right properties, gaining immense satisfaction from helping clients achieve their dreams.
Properties Highlighted In This Article


Let’s Discuss Your Property Plans
Interested in This Property?
Buying, selling or renting? Get a free consultation with realtors with a background in interior and lighting design. We’ll discuss your goals and help you assess your options—from pricing and timelines to layout practicality and space potential.
Share your contact details below, and we will get in touch to understand your needs and suggest the next steps. No pressure. No obligation to proceed.