
Tengah Garden Residences: Strategic Overview, Development Fundamentals and Future Demand Drivers
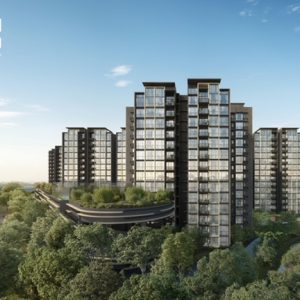
Tengah Garden Residences (TGR) is a private residential development of the Government Land Sales (GLS) private residential site at Tengah Garden Avenue, awarded at a bid price of S$675 million to a consortium comprising GuocoLand (via its subsidiary), Hong Leong Holdings (via Intrepid Investments), and CSC Land Group. The site is 99-year leasehold, about 25,458.4 sqm, and zoned “Residential with Commercial at 1st Storey”, with a yield of 860 units.
Tender Summary
Tengah Garden Avenue
GuocoLand (Singapore) Pte. Ltd.
From a location standpoint, there are three demand anchors that are directly relevant to tenant willingness-to-pay: the land parcel is next to the upcoming Hong Kah MRT Station on the Jurong Region Line (JRL), is opposite the future Tengah Hospital, and is near major greenery/park features planned for Tengah.

By 2031, Tengah is expected to be significantly more mature and liveable compared to most towns in their initial phases. The town is designed around a car-free town centre (with roads running underground), prioritising pedestrian and cyclist mobility, and will be integrated with the future JRL, alongside distributed neighbourhood centres and planned amenities across its districts.
On the healthcare front, a new hospital is slated for Tengah in the early 2030s, with NUHS positioning the Tengah General and Community Hospital as an integrated component of the Tengah Forest Town. Such a tertiary healthcare node is likely to generate sustained rental demand from healthcare professionals, support staff, students and trainees, as well as short-term medical postings—particularly given its proximity to an MRT station.
On transport timing, JRL delivery has experienced schedule updates; reporting indicates Phase 1’s opening shifted to mid‑2028 (instead of earlier targets), implying that by a Sep 2031, vacant possession, the Hong Kah station’s rail service should be operating under most plausible scenarios—though investors should still treat delivery dates as a risk variable.
Why URA floor-area harmonisation matters for our yield calculations
TGR falls under URA’s harmonised floor area framework, which is a critical consideration as it can skew direct “rent $/sqft” comparisons with older condominium and EC developments.
Effective 1 June 2023, URA—together with SLA, BCA and SCDF—implemented harmonised floor area definitions. Key changes include measuring floor areas to the midpoint of walls, incorporating all strata areas into Gross Floor Area (GFA), and excluding void spaces from strata calculations. Air-conditioning ledges are also counted as GFA if included within the strata area, unless they are designated and maintained as common property under specific conditions.
From an investment perspective, tenants do not price units based on regulatory floor definitions, but on usable attributes such as layout efficiency, bedroom count, location and furnishing. As a result, since a harmonised project excludes non-liveable spaces within its strata area, applying older projects’ rent psf benchmarks directly may lead to under-estimation of achievable rents. Similarly, cross-project rent psf comparisons should be treated as indicative rather than exact, particularly when different measurement standards are involved.
To address this, the analysis focuses on observed rental psf and absolute rent levels from selected benchmark clusters, translating them into scenario-based ranges instead of a single-point estimate. Consequently, the output is presented as a range of projected gross yields to better reflect real-world variability.
Comparable rental clusters today and what they imply
The goal is to anchor TGR’s future rent to current real market rents in “nearby or structurally similar” developments, then forward-project to 2031.

Rental comparables aligned to our five selected clusters
The table below uses rental statistics from PropNex’s Protrend/Property Analysis as quick benchmarks for 2025–2026 conditions.


Rental Benchmark Projects
How to interpret the Copen Grand datapoint correctly
Copen Grand reflects a relatively low average rental psf, with only a single recent transaction recorded at around S$6,000. This should be viewed as contextual evidence rather than a core input for pricing, as Executive Condominiums (ECs) are subject to HDB regulations that can constrain or distort the formation of a fully open rental market in their early years.
Under HDB regulations, an EC can only be fully rented out after fulfilling its 5-year Minimum Occupation Period (MOP). Consequently, any early rental activity—such as approved exceptions (Overseas work, ect) or partial leasing—does not reflect a fully open and mature rental market.
For TGR, this means Copen Grand serves only as a directional reference rather than a reliable benchmark, and should not be used to anchor long-term rental projections such as the 2031 rent outlook.

A defensible “today-equivalent” rent psf anchor for TGR
If we give more weight to the West-region comparables (J Gateway, Lakeside set, Le Quest) and keep Lentor Modern as a structural “new MRT precinct” analogue, a reasonable composite anchor for “TGR-like positioning” in today’s market is around ~S$6.0 psf for an all-unit average—before unit-type adjustments. This is consistent with the spread implied by the projects above (roughly mid‑5s to high‑6s).
Forward projection to 2031 rents using market-wide indicators
Because we’re buying in 2026-ish and only receiving keys around Sep 2031, the biggest uncertainty is not “what is rent today?” but “where will the rental cycle be in 2031?” The least hand-wavy way to handle this is scenario analysis anchored to official rent indicators.
What the official rental index says about the recent cycle
URA’s private residential rental index is published through official channels and (per data.gov.sg’s description) is computed using information obtained from returns filed with IRAS, and from 2015-Q1 onwards uses a stratified hedonic regression methodology to control for attribute differences such as age and size.
URA data indicates that the rental market has entered a phase of moderation and stabilisation. Private residential rents declined slightly by 0.5% quarter-on-quarter in Q4 2025, reversing the growth seen in the previous quarter, while still registering a 1.9% increase on a year-on-year basis for 2025.
The takeaway for forecasting is that assuming “2021–2023 style rent spikes” as our base case is not conservative. A more defensible approach is to assume low-to-moderate compounded growth from the 2026 base into 2031, then test yields under multiple rent-growth paths.
Rent-growth scenarios used in this report
To translate the ~S$6.0 psf (today-equivalent) composite anchor into 2031, we use three nominal growth paths over ~5 years:
- Conservative: ~1% CAGR → average rent ~S$6.3 psf by 2031
- Base: ~2% CAGR → average rent ~S$6.6 psf by 2031
- Upside: ~3% CAGR → average rent ~S$7.0 psf by 2031
These scenario magnitudes are chosen to be consistent with a stabilising rent environment (rather than extrapolating an exceptional spike), while still allowing for a “West transformation + MRT adjacency” premium to express itself. The existence of the rental index series and recent moderation context are grounded in URA-linked publications.
Rental yield for TGR using launch price assumptions
Price inputs and the yield definition
Official indicative starting prices are as follows:
- 1BR (480–515 sqft) from S$980,000
- 2BR (610–750 sqft) from S$1,100,000
- 3BR (795–1030 sqft) from S$1,588,000
- 4BR (1130–1260 sqft) from S$2,288,000
These entry prices typically correspond to lower-floor units. For higher-floor units, a working assumption of approximately a 20% premium is applied.
This analysis calculates the gross rental yield as (monthly rent × 12) ÷ purchase price, using typical mid-size units as working points (500 / 680 / 900 / 1200 sq ft). Gross yield is the standard first-pass measure; actual investor outcomes will be lower after vacancy, agent fees, maintenance contributions, and property tax.
Bedroom-type rent psf structure
Across Singapore condos, smaller units typically achieve higher psf rents than larger family units. This pattern is evident even in our West benchmark (e.g., J Gateway’s 1BR psf is often higher than 3BR/4BR psf in the transaction summaries).
To incorporate that shape without overfitting, the model sets unit-type psf as a multiplier on the “project average rent psf”:
- 1BR: 1.10× project average
- 2BR: 1.00× project average
- 3BR: 0.85× project average
- 4BR: 0.82× project average
These multipliers are calibration devices for scenario planning; they are directionally consistent with the unit-size rent psf gradient observable in project-level transaction summaries.
Results: expected 2031 rents and gross yields
Using the scenario-average psf ($6.3 /$ 6.6 /$ 7.0) and the official starting prices:
2031 Monthly Rent Scenarios
1BR
2BR
3BR
4BR
Corresponding gross rental yields on the official starting prices:
Projected Rental Yield by Unit Type
1BR
2BR
3BR
4BR
If the unit is transacted at a 20% premium above the starting price (reflecting higher-floor units), rental yields would compress by approximately one-sixth due to the higher capital base. Under the Base rental scenario, the estimated yields would adjust to:
- 1BR: ~3.70%
- 2BR: ~4.08%
- 3BR: ~3.18%
- 4BR: ~2.84%
Sanity check against today’s West benchmarks
The rents implied by the Base case broadly align with what already occurs today in West projects: J Gateway’s average rent is about S$6.92 psf (in 2025), and Lake Grande’s is about S$6.00 psf, with smaller units often achieving higher psf rents. Since our Base case assumes an average of ~S$6.6 psf in 2031, it is not an aggressive outlier relative to today’s best-performing West comparables; it is closer to a “continuation with modest growth and Tengah maturation.”

Is TGR a good buy on rental yield, and what could break the thesis
Based purely on quantitative analysis, TGR’s projected gross yield at key collection appears competitive for an OCR new launch—particularly for 2-bedroom units (and to a lesser extent 1-bedroom units, given the limited supply). Using official starting prices and conservative-to-base rental assumptions, yields are expected to cluster in the ~4–5% range. This is further supported by existing West-region developments already achieving rental levels in the mid-$5 to high-$6 psf range.
In addition, TGR falls under the harmonised floor-area framework, which may result in comparatively higher effective rental psf—potentially in the range of 5–8% above older developments—due to differences in how strata areas are defined and measured.
The primary risk lies in timing and infrastructure delivery. Although JRL Phase 1 is currently projected for completion around mid-2028, any further delays could dilute the anticipated MRT-driven rental premium during the initial leasing phase.
A second key risk is supply dynamics. URA pipeline data highlights the impact of upcoming completions on rental performance. Tengah is undergoing rapid development, and a surge in surrounding supply between 2030 and 2033 could exert downward pressure on rents, even as the town matures.
In summary, if the investment objective is yield at TOP, TGR presents a reasonably sound proposition—particularly for 2-bedroom units—under moderate rental growth assumptions aligned with current West-region benchmarks. However, for investors seeking higher certainty of returns, the project should be evaluated holistically, factoring in deferred income until 2031, reliance on future infrastructure and township maturation, and exposure to supply-side risks, rather than relying solely on projected rental yield.
Disclosure: This post is for educational and analytical purposes. It is not financial advice. Projections are based on the provided ProTrend graph values, our inferred prices and comparability assumption, and indicative prices (accurate as of 8th April 2026). Actual construction costs, timelines, and market conditions may vary.
>
Article contributed by Jerry Wong.

Jerry Wong is a realtor at Propnex Realty, bringing a rich background in interior and lighting design to his work. He loves exploring diverse spaces and observing the transformative power of real estate. Beyond his professional role, Jerry finds his greatest fulfillment in connecting people with the right properties, gaining immense satisfaction from helping clients achieve their dreams.
Properties Highlighted In This Article


Let’s Discuss Your Property Plans
Interested in This Property?
Buying, selling or renting? Get a free consultation with realtors with a background in interior and lighting design. We’ll discuss your goals and help you assess your options—from pricing and timelines to layout practicality and space potential.
Share your contact details below, and we will get in touch to understand your needs and suggest the next steps. No pressure. No obligation to proceed.