
What changed and why it matters for investors
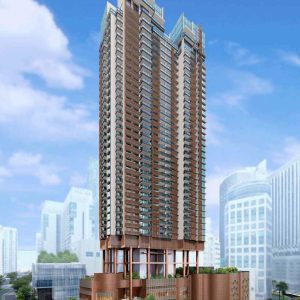
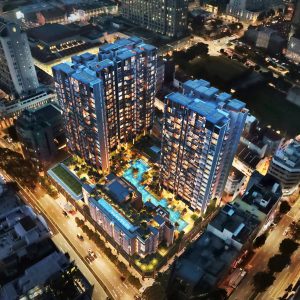
Union Square Residences (part of CDL’s larger “Union Square” mixed-use redevelopment) has newly announced discounted prices for selected units. In a yield-driven market, a price cut can be more important than it looks on the surface because rental yield is calculated off your entry price: all else equal, a lower purchase price mechanically increases yield.
Here are some of the discounted units and what the discounts mean in practical terms (based on the prices you provided):
- 3BR #05-03, Type C1, 990 sqft: from $2.82M ($2,848 psf) to $2.60M ($2,626 psf) → about $220K saved (~7.8%)
- 2BR #03-11, Type B1, 710 sqft: from $2.024M ($2,851 psf) to $1.88M ($2,648 psf) → about $144K saved (~7.1%)
- 1+Study #03-10, 506 sqft: from $1.49M ($2,945 psf) to $1.318M ($2,605 psf) → about $172K saved (~11.5%)
The other bigger picture is timing. CDL has communicated an indicative TOP timing of Q1 2029 for Union Square Residences, while also showing an Expected Date of Vacant Possession of 15 March 2031 (a contractual long-stop date) on its construction progress page. This matters because your “real” rental commencement (and therefore yield) typically starts around the time of vacant possession/keys collection, not the contractual final backstop date.

The micro-location advantage: a “fringe” District 1 project with Core Central Region dynamics
CDL positions Union Square as being in prime District 1, along Havelock Road, “at the gateway to the CBD and heart of the Singapore River precinct,” and within walking distance of Clarke Quay, Chinatown, and Fort Canning MRT.
From an investor lens, the most useful way to classify this is not just “District 1,” but Core Central Region (CCR) dynamics—because tenant budgets, competition set, and (often) rent per square foot behaviours differ from RCR/OCR. URA’s definitions for property statistics explicitly state that CCR comprises postal districts 9, 10, 11, as well as Downtown Core and Sentosa, with the Rest of Central Region (RCR) being the remainder of the Central Region.
In simple English: Union Square’s positioning near the CBD/Singapore River/Clarke Quay places it in the conversation with other “city” rental markets, where demand is often supported by (i) CBD workers and (ii) tenants who value being near nightlife, riverfront, and transit nodes—especially if the development is integrated/mixed-use.
CDL’s redevelopment narrative also matters. “Union Square” is described as the first redevelopment in the Singapore River Planning Area under URA’s Strategic Development Incentive (SDI) Scheme, achieving a 67% GFA uplift to ~735,500 sq ft, and comprising Grade A office, retail, co-living (with hotel licence), and a 366-unit luxury residence.
Mixed-use isn’t automatically “better,” but it can support rentability when the commercial/office components generate daily footfall and amenity convenience—key decision factors for tenants paying city rents.
The benchmark set used and what the attached data is really saying
We selected three benchmark developments to form a balanced and relevant comparison framework for Union Square Residences:
- River Place (older, larger-format, District 3, not mixed-use, but very relevant by proximity and unit sizing). River Place is a 99-year leasehold condo with TOP 2000, comprising 509 units, located along Havelock Road.
- The M (newer mixed development in District 7). The M is a mixed development comprising commercial units and 522 residential units, with a 99-year leasehold.
- One Bernam (newer mixed development in District 2 / CBD edge). One Bernam is a 99-year leasehold development with 351 units, completed in 2025.
The PropNex Investment Suite “ProTrend” data (2015–2026) offers a consistent, like-for-like comparison of both sale psf and rental psf trends across different bedroom types for these three developments. This dataset will serve as the quantitative foundation for the analysis that follows.
1 Bedroom Sale And Rental Chart


2 Bedroom Sale And Rental Chart


3 Bedroom Sale And Rental Chart


A quick interpretation of what those snapshots imply:
- Newer mixed-use projects (The M, One Bernam) generally show higher rental psf than the older River Place across 1BR/2BR/3BR bands (with especially notable gaps in 1BR and 2BR).
- River Place’s value is that it provides a “floor” for what happens when a project is older and has larger unit sizes—useful for stress-testing a downside rent scenario.
- 3BR data tends to be noisier (fewer transactions and more layout variation—e.g., dual-key effects explicitly noted for The M), so your 3BR forecast should be presented as a range, not a single-point estimate.
Rental market context to 2029: why “low single-digit growth” is a reasonable base case
Projecting 2029 rents is inherently uncertain, so the goal is to set defensible scenario bands.
Two big, well-cited macro realities matter:
Singapore’s private rental cycle has already gone through its post-COVID boom and normalisation phase: private residential rents hit their highest level in 2023, surpassing the prior 2013 peak, then fell by 1.9% in 2024 and stabilised in 2025, according to reporting citing URA and market data providers. This suggests that 2029 projections should generally avoid assuming “bubble-era” rental growth will repeat.
Supply is expected to rise materially through 2027–2028. – The same reporting cites URA-based projections that private homes (excluding ECs) obtaining TOP are projected to expand from 5,249 (2025) to 7,006 (2026), 8,955 (2027) and 10,195 (2028)—which implies more landlord competition heading into the 2027–2029 window.
Given that setup, it’s defensible to model Union Square’s 2029 rent on (a) current CCR-ish/City mixed-use rent psf benchmarks plus (b) modest nominal growth (e.g., 0%–3% p.a.) rather than aggressive growth.
As a technical note on data quality: URA’s private residential rental indices are derived from tenancy information filed with IRAS and (from 2015-Q1) computed using a stratified hedonic regression methodology to control for factors like age and size. This is one reason it’s better to use ranges and scenarios rather than single-point prophecies.
Projected 2029 rents and yields for the discounted units
The methodology below is designed to be clear, straightforward, and easy to understand
- Start with our attached PropNex’s Protrend 2026 rental psf signals from the two newer mixed-use benchmarks (The M and One Bernam) as the “city mixed-use” anchor.
- Run three rent scenarios through to 2029 (TOP window):
- Downside: flat rents to 2029 (0% p.a.) and uses a lower benchmark within the mixed-use set
- Base: 2% p.a. rent growth to 2029, and uses the blended mixed-use benchmark
- Upside: 3% p.a. rent growth to 2029 and uses the higher benchmark within the mixed-use set
- Convert rental psf to monthly rent using Union Square unit sizes, then compute the gross yield.
The headline output: scenario yield ranges
Interpretation: – The 1+Study is the clearest “yield engine” of the three because the entry price is lower, while city-core small-unit rent psf is typically the strongest (your benchmark data reflects this pattern). – The 2BR sits in the middle ground: often easier to rent to couples/sharers, but with a higher capital base. – The 3BR is usually the lowest yield because the absolute rent rises, but not enough to fully “keep up” with the larger ticket size; also, the tenant pool depth can be thinner at higher monthly rents.
Projected 2029 monthly rents and gross yields (at discounted price (as of 24th March 2026))
| Unit | Scenario | Est. 2029 Rent psf | Est. 2029 Monthly Rent | Est. Gross Yield (discounted price) |
| 1+Study (506 sqft, $1.318M) | Downside | ~8.16 | ~$4,129 | ~3.76% |
| 1+Study | Base | ~9.35 | ~$4,733 | ~4.31% |
| 1+Study | Upside | ~10.35 | ~$5,236 | ~4.77% |
| 2BR (710 sqft, $1.88M) | Downside | ~7.15 | ~$5,077 | ~3.24% |
| 2BR | Base | ~8.03 | ~$5,700 | ~3.64% |
| 2BR | Upside | ~8.72 | ~$6,191 | ~3.95% |
| 3BR (990 sqft, $2.60M) | Downside | ~6.55 | ~$6,485 | ~2.99% |
| 3BR | Base | ~7.33 | ~$7,254 | ~3.35% |
| 3BR | Upside | ~7.93 | ~$7,854 | ~3.62% |
What the discount did to “day-one” yield math
Because rent doesn’t change just because the developer discounts the unit, the discount acts like an immediate yield booster:
- 1+Study: yield uplift of roughly +0.43 to +0.55 percentage points versus the old $1.49M price (depending on rent scenario).
- 2BR: roughly +0.23 to +0.28 percentage points versus the old $2.024M price.
- 3BR: roughly +0.23 to +0.28 percentage points versus the old $2.82M price.
In other words, the discount especially matters for the small unit (where the % discount is the largest), which is consistent with the ~11.5% price cut quoted for the 1+Study.
A reality check investors often miss: property tax can materially reduce net yield
Gross yield is not net yield.
If the unit is not owner-occupied, Singapore applies non-owner-occupier residential property tax on a progressive schedule. IRAS explains that property tax is computed by multiplying the property’s Annual Value (AV) by the applicable tax rates.
For non-owner-occupied residential properties (effective 1 Jan 2024), the marginal rates shown by IRAS are 12% on the first $30,000 of AV, 20% on the next $15,000, 28% on the next $15,000, and 36% on AV above $60,000.
IRAS also states that property tax applies whether the property is rented, owner-occupied, or vacant.
Illustrative impact (base-rent scenario, assuming AV is approximately the annual rent) can look like this:
- 1+Study (base): gross yield ~4.31% → after property tax only, ~3.56%
- 2BR (base): gross yield ~3.64% → after property tax only, ~2.90%
- 3BR (base): gross yield ~3.35% → after property tax only, ~2.56%
This is not meant to “scare” buyers—it’s meant to stop investors from overestimating take-home yield. Maintenance fees, agent fees, repairs, and occasional vacancies will further reduce net yield.
So, is it a “good buy” at the discounted prices?
Taking into account our selected benchmarks and a measured 2029 rental outlook—guided by (i) the post-2023 rental market normalisation and (ii) increasing housing supply leading up to 2028—the discounted units can be assessed as follows:
The discounts materially enhance the investment case, particularly for the 1+Study unit. For yield-focused buyers, the 1+Study at approximately $2,605 psf (after discount) is the most compelling option. Smaller-format, CCR-oriented units typically enjoy stronger and more consistent tenant demand, and the benchmark data indicates that the 1-bedroom segment has demonstrated resilient rental psf performance across comparable city developments.
The 2BR looks like a “balanced investor” choice rather than a pure yield play. At ~$2,648 psf, the 2BR is slightly pricier psf square foot than the 1+Study, and it needs a stronger absolute rent to hit the same yield band. Still, it may have more stable tenant profiles (couples, small families, sharers) and can be easier to rent in some market conditions, depending on tenant wage budgets.
The 3BR is the lifestyle/family positioning, with yields that look acceptable but typically not “best-in-class.” At ~$2,626 psf, the 3BR discounted price is meaningful, but the rental hurdle is also higher. In most central-city condos, 3BRs are where investors often trade off yield for other goals (e.g., own-stay optionality, larger space, or a longer-hold capital-value thesis).
Finally, while Union Square’s mixed-use positioning is a genuine advantage, it does not come without trade-offs. CDL’s Union Square is a large-scale SDI-driven redevelopment integrating office, retail, and co-living components alongside a 366-unit residential tower, with completion targeted around 2029. Mixed-use convenience can enhance tenant appeal, but investors should also remain realistic about future competing supply and the expectation that Singapore’s 2026–2028 completion pipeline will rise.
If we distil everything into a clear and practical takeaway:
At the new discounted prices, Union Square Residences looks materially more competitive on yield—particularly for the 1+Study, which has the best chance of landing in a ~4% gross yield band by vacant possession under reasonable rent assumptions. The 2BR can work for investors seeking a balance of rentability and liveability, while the 3BR is more suitable for buyers who want own-stay flexibility first and treat rental yield as a secondary benefit rather than the main objective.
Disclosure: This post is for educational and analytical purposes. It is not financial advice. Projections are based on the provided ProTrend graph values, our inferred prices and comparability assumption, and indicative prices (accurate as of 24th March 2026). Actual rents, yields, and timelines may differ.
Article contributed by Jerry Wong.

Jerry Wong is a realtor at Propnex Realty, bringing a rich background in interior and lighting design to his work. He loves exploring diverse spaces and observing the transformative power of real estate. Beyond his professional role, Jerry finds his greatest fulfillment in connecting people with the right properties, gaining immense satisfaction from helping clients achieve their dreams.
Properties Highlighted In This Article

Let’s Discuss Your Property Plans
Interested in This Property?
Buying, selling or renting? Get a free consultation with realtors with a background in interior and lighting design. We’ll discuss your goals and help you assess your options—from pricing and timelines to layout practicality and space potential.
Share your contact details below, and we will get in touch to understand your needs and suggest the next steps. No pressure. No obligation to proceed.