
Why this analysis isn’t “like-for-like” and what we’ll do instead
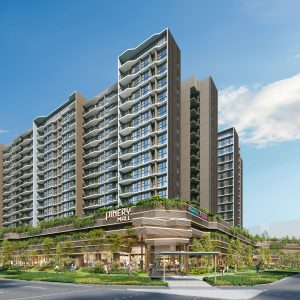
Pinery Residences is a new mixed-use development in Tampines (District 18) that is unusually transit-convenient, featuring an underground, sheltered pedestrian link (about 156 m) to Tampines West MRT on the Downtown Line. That combination—new launch + mixed-use + underground linkway to MRT—creates a comparison problem: most condos are either (a) pure residential, (b) near an MRT but not physically connected, or (c) “integrated developments” that sit directly on top of an MRT interchange and a mall/bus interchange.
Instead of trying to identify a single “perfect” comparable—which in reality does not exist—we analyse three different groups of comparable developments to form a more balanced comparison.
- Integrated (closest convenience-match): Pasir Ris 8 and Bedok Residences. Pasir Ris 8 is the first integrated development in the heart of Pasir Ris, with direct access to the mall below and the MRT/bus network. Bedok Residences is also an integrated development above a shopping space and the Bedok bus interchange/transport hub.
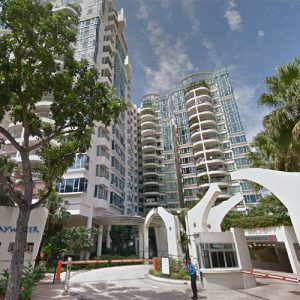
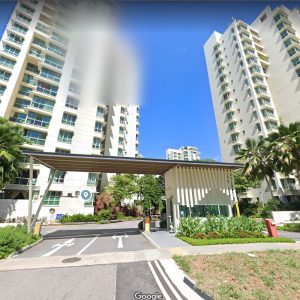
- Downtown Line corridor (DTL accessibility, but non-integrated product): The Clearwater (near Bedok Reservoir DTL) and Baywater. These help us observe how DTL-linked East-side rentals behave without integrated retail/transport baked into the building.
- Tanah Merah/airport corridor (East-West Line interchange proxy): Urban Vista, Grandeur Park Residences, and The Glades—useful for gauging whether the Blue line vs Green line (DTL vs EWL) implies materially different rental willingness near an MRT interchange catchment.
The rest of this post quantifies (1) where these peer sets sit today and (2) what that implies for projected Q4 2029 rent and gross rental yield for Pinery Residences Type B1 (2 bed, 2 bath, dumbbell layout).

The two key modelling assumptions we used
Harmonised vs non-harmonised size adjustment
Pinery Residences follows the harmonised floor area measurement framework. To ensure a fair comparison with older developments—which typically report non-harmonised floor areas—the Type B1 unit is adjusted and analysed based on its estimated non-harmonised size.
- 624 sqft (harmonised) + ~31 sqft estimated A/C ledge area
- ≈ 655 sqft (estimated non-harmonised-equivalent) for comparison
This makes sense conceptually because Singapore moved toward harmonising floor area definitions across agencies. In the joint circular by URA/SLA/BCA/SCDF, key changes include measuring to the middle of walls, including all strata areas as GFA, and excluding voids from strata area.
Crucially for the “aircon ledge add-back,” the same circular explains that A/C ledges included as strata area would be computed as GFA; developers who retain A/C ledges as common property can keep them excluded from GFA (within stated parameters). In consumer terms, projects launched under/after the harmonised framework can show different “saleable vs internal” trade-offs than older projects, so normalising size for comparison is a reasonable approach.

Purchase price bands for yield calculations
Yields will be estimated using two pricing scenarios to provide a clearer view of the potential investment returns.
Lower entry band: $1,498,000 (starting price)
Higher band: $1,797,600 (approximately 20% above the starting price, representing a higher-floor or upper-band pricing assumption used to stress-test the projected yield).
What the Peer Groups Are Telling Us Today
The six charts (PropNex Investment Suite ProTrend, generated on 12 March 2026) provide three rental datasets and three sale datasets. The table below summarises what these charts show at the project level, including the rental psf range, average monthly rent, sale psf range, and average sale price, together with an indicative gross yield calculated using the following formula:
Indicative gross yield ≈ (Average monthly rent × 12) ÷ Average sale price
Data source note: The figures used in the table are derived from the six ProTrend charts generated on 12 March 2026. Average values are used in this analysis because some projects show sudden variations in their trendlines. These fluctuations may be caused by a limited number of transactions or outlier deals that temporarily skew the data—for example, the sharp price dip observed for Urban Vista and the sudden rental spike recorded for The Clearwater. Using averages helps smooth out these anomalies and provides a more representative basis for comparison.


| Peer group | Project | Rent (psf/mo) range | Avg monthly rent | Sale (psf) range | Avg sale price | Indicative gross yield |
| Integrated (MRT + mall) | Bedok Residences | 3.68–5.62 | $3,576 | 1,434–1,806 | $1,392,750 | 3.08% |
| Integrated (MRT + mall) | Pasir Ris 8 | 5.02–5.36 | $3,794 | 1,641–2,078 | $1,283,810 | 3.55% |
| DTL corridor (non-integrated) | The Clearwater | 2.59–4.25 | $2,880 | 859–1,292 | $1,053,091 | 3.28% |
| DTL corridor (non-integrated) | Baywater | 2.51–3.83 | $3,096 | 810–1,322 | $1,135,979 | 3.27% |
| Tanah Merah (EWL interchange) | Urban Vista | 3.51–5.38 | $2,507 | 1,269–1,615 | $942,369 | 3.19% |
| Tanah Merah (EWL interchange) | Grandeur Park Residences | 4.70–6.48 | $3,437 | 1,413–2,024 | $949,309 | 4.34% |
| Tanah Merah (EWL interchange) | The Glades | 3.73–5.90 | $2,924 | 1,418–1,776 | $998,663 | 3.51% |
Interpreting the three groups in plain English
Integrated development benchmark (Pasir Ris 8, Bedok Residences).
In the summarised dataset, integrated developments cluster around high rent psf—and that’s consistent with the lived reality of integrated projects: daily convenience and “always-sheltered” access tends to command a premium (even if buyers also pay a premium). Bedok Residences is an integrated development above a shopping mall and the bus interchange/transport hub, while Pasir Ris 8 is an integrated development with the mall directly below and strong MRT connectivity (EWL and future Cross Island Line interchange).
Downtown Line Corridor Benchmark (The Clearwater, Baywater)
The Clearwater and Baywater appear in the charts at noticeably lower rental psf ranges. While this provides useful insight into rental trends along the Downtown Line (DTL) corridor in the East, there is a clear difference in unit sizes when compared to Pinery Residences Type B1.
At The Clearwater (completed in the early 2000s), 2-bedroom units typically range from 947 to 1,109 sqft (non-harmonised). Similarly, Baywater features 2-bedroom units ranging from 1,033 to 1,141 sq ft (non-harmonised).
As these units are generally around 1,000 sq ft, they tend to cater to a different tenant profile than a ~655 sq ft 2-bedroom dumbbell layout like the one at Pinery Residences. Larger units are often more suitable for small families, whereas the compact dumbbell layout is designed to maximise privacy and rental flexibility, making it more attractive for couples, small households, or two unrelated tenants sharing the unit.
As such, while Clearwater and Baywater provide useful context for rental trends along the Downtown Line, they are less ideal as direct comparisons in terms of unit size and layout.
Tanah Merah benchmark (Urban Vista, Grandeur Park Residences, The Glades).
This group helps address the “Blue Line vs Green Line proximity” comparison. Based on the ProTrend charts, developments located close to MRT stations in the East—particularly those near major interchange catchments—have historically supported rental levels in the mid-$5 to low-$6 psf range during stronger rental periods.
This set of developments is also useful because several of their unit sizes are closer to the adjusted comparison size of 655 sqft used in this analysis.
Urban Vista features many 2-bedroom units in the ~549–614 sq ft range (non-harmonised), which is relatively close to the 655 sq ft modelling size.
Grandeur Park Residences offers 2-bedroom deluxe units of about 55–58 sqm (approximately 592–624 sqft, non-harmonised), which closely resemble the compact dumbbell-style 2-bedroom layouts around 592 sqft.
The Glades offers a wider range of 2-bedroom unit sizes in the market, including 581 sq ft, 624 sq ft, 667 sq ft, 700 sq ft, and 721 sq ft. Because of this variation, it serves better as a range-based benchmark rather than a direct one-to-one size comparison.
Pinery Residences rent projection for Q4 2029 and what that means for yield
Pinery’s “starting point” rent psf anchor
Because Pinery is mixed-use with a direct underground linkway (and therefore closer to integrated-like convenience than a standard condo), the most defensible anchor is the integrated + Tanah Merah near-MRT band, not the Clearwater/Baywater band.
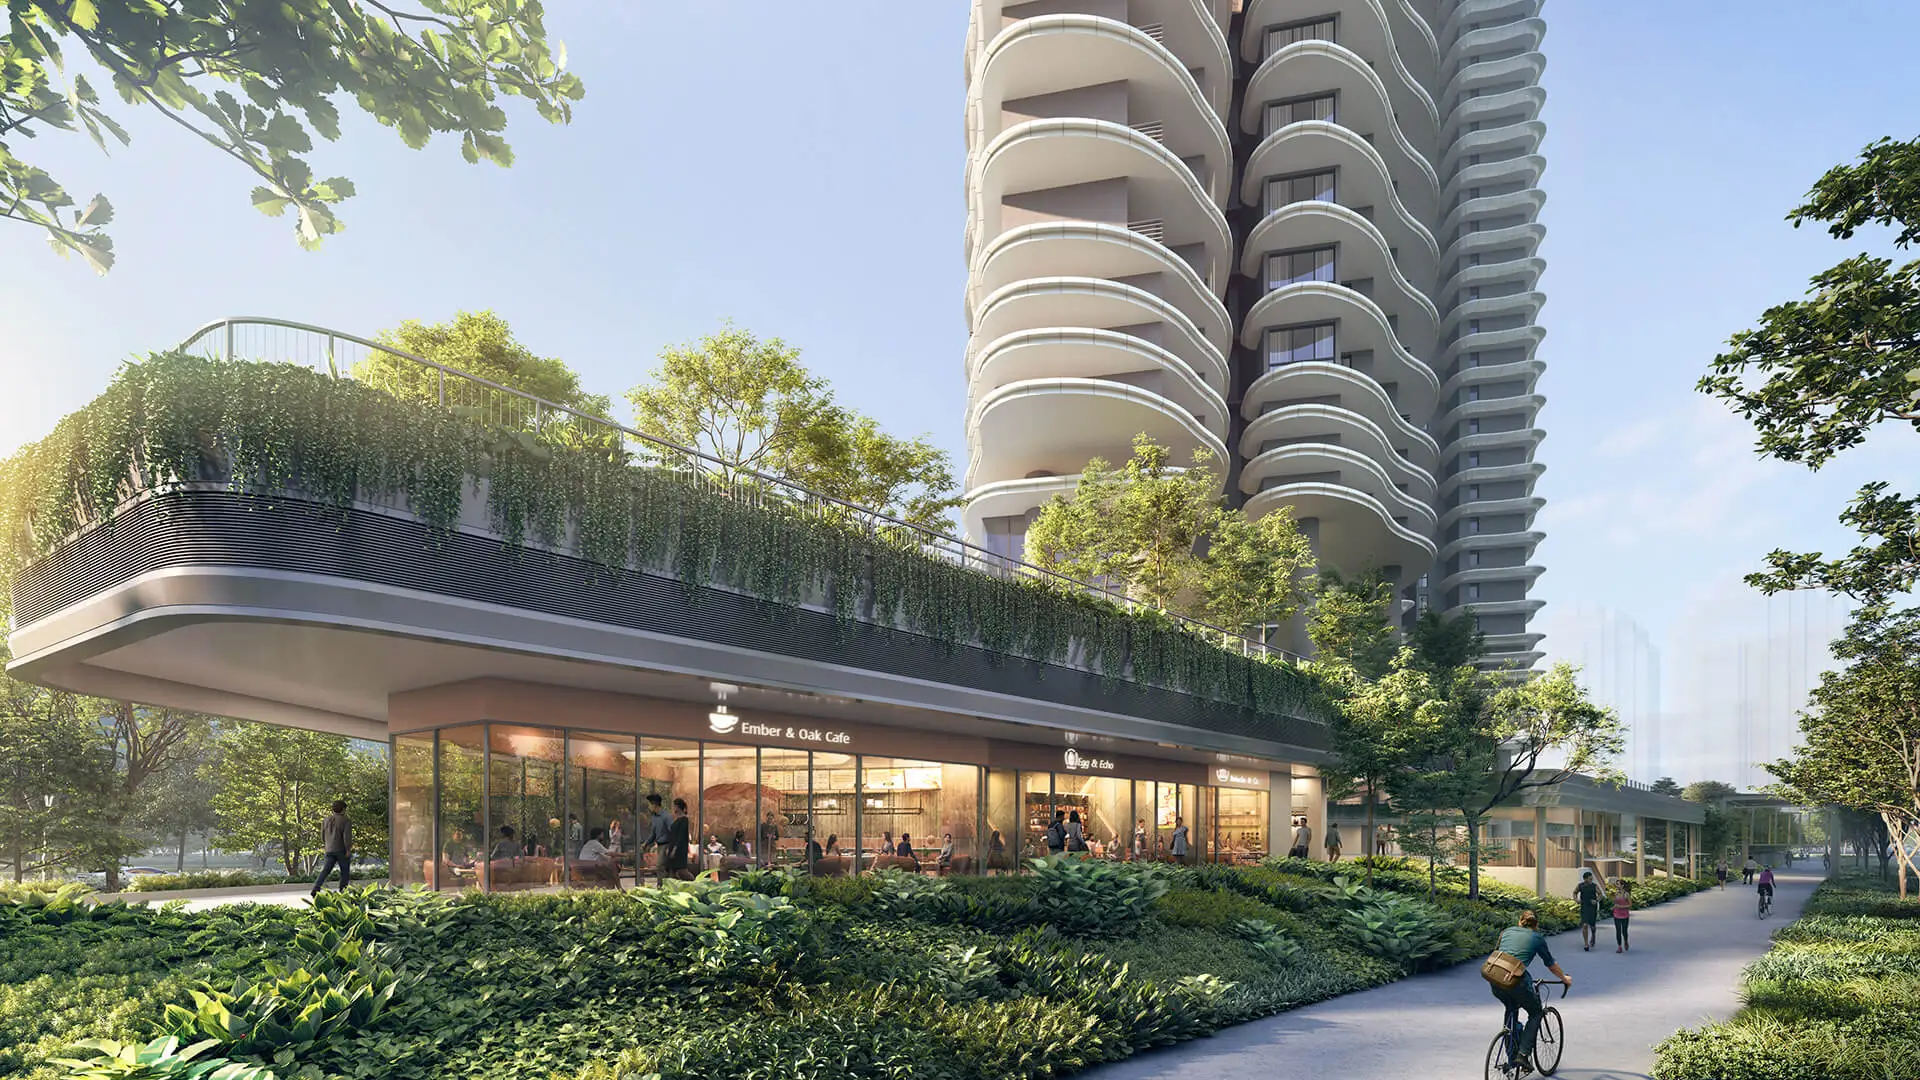
Pinery Residences also features an underground sheltered pedestrian link of approximately 156 metres to Tampines West MRT, together with a mixed-use podium that includes retail shops, food outlets, a supermarket, and a preschool.
It is therefore more practical to present a range of scenarios rather than rely on a single precise forecast.
- Conservative scenario (Q4 2029): $5.50 psf/month
- Base scenario (Q4 2029): $6.00 psf/month
- Upside scenario (Q4 2029): $6.50 psf/month
Why those levels are defensible using the peer sets: – The integrated and Tanah Merah groups already show recent rent psf reaching the mid-$5s to low-$6s in the last couple of years of the series provided (i.e., not a hypothetical level). Pinery delivers in Q4 2029, meaning it is brand-new at rental launch—often supporting a modest premium versus older resale stock (though premium size varies by cycle and competing supply).
Projected Pinery monthly rent and gross yield at your two price bands
Using the comparison size of 655 sqft, the rent and yield outcomes are:
| Scenario (Q4 2029) | Rent ($/sqft/mo) | Projected monthly rent (655 sqft) | Gross yield @ $1,498,000 | Gross yield @ $1,797,600 |
| Conservative | $5.50 | $3,602 | 2.89% | 2.40% |
| Base | $6.00 | $3,930 | 3.15% | 2.62% |
| Upside | $6.50 | $4,258 | 3.41% | 2.84% |
How those yields “fit” versus today’s peer-set yields
If we compare Pinery’s projected yields to the indicative gross yields implied by the peer sets (from the ProTrend chart averages):
- A ~3.1% gross yield (Pinery base case at $1.498M) is very much “in-family” with the 3.1%–3.6% cluster implied by Bedok Residences, Pasir Ris 8, Urban Vista, Clearwater, Baywater, and The Glades (based on their average rent vs average resale price in the Protrend charts).
- A ~2.6% gross yield (Pinery base case at $1.7976M) is a realistic outcome for “best stacks / higher floors” where capital value rises faster than rent, and the yield compresses—common in MRT-convenient formats.
A key takeaway is this: Pinery Residences is unlikely to offer the highest rental yield in the East. Instead, based on the peer comparisons, it is more likely to deliver a stable, mid-range yield, supported by its strong attributes—being a brand-new, MRT-linked mixed-use development with excellent convenience. This could make it particularly attractive to buyers who prioritise consistent tenant demand and long-term rental resilience.
Why Pinery could rent above or below the peer-set benchmarks
Reasons Pinery could outperform the base-case rent psf
Pinery has three demand drivers that are hard to replicate in standard condos:
First, station-access convenience that behaves “almost integrated,” even if not structurally identical to Pasir Ris 8 / Bedok Residences. The project has an underground link (~156 m of sheltered tunnel) to Tampines West MRT, which may matter to tenants who commute daily and value weatherproof access.
Second, the mixed-use concept provides daily conveniences right at the doorstep. Developments with well-curated retail components—such as supermarkets, food options, and essential services—often see stronger rental appeal because they enhance everyday convenience for residents. Pinery Residences adopts this approach through its commercial podium that integrates retail and daily lifestyle amenities within the development.
Third, this specific B1 unit type is rent-friendly: a 2-bed/2-bath dumbbell layout often widens the tenant pool (e.g., couples + WFH, small families, or “two professionals” roommate setups where each bedroom can function as a more independent suite).
Reasons Pinery could underperform the base-case rent psf
The most important risk is simply value vs budget competition. Tenants may like convenience, but they still compare the absolute monthly rent. If multiple new completions hit the same window (Tampines/Bedok/Upper East Coast), renters may have alternatives, limiting the premium.
Also, mixed-use is a double-edged sword. Some tenants love it; others avoid it due to footfall, noise, deliveries, and weekend activity, depending on the retail mix and how the podium is designed/managed.
Finally, don’t ignore the math risk: the higher-band purchase price is explicitly meant as a stress test. At $1.7976M, even a strong rent psf outcome can still produce a mid-2% gross yield—because the denominator is large.
Bottom line for homebuyers and investors
Pinery Residences is difficult to compare because it sits between two categories: it is not a classic “integrated development” like Pasir Ris 8 (MRT + mall + bus interchange), but it is also not a typical “near MRT” condo because it has an underground sheltered pedestrian link to Tampines West MRT and a mixed-use podium concept.
Using the three peer groups and the adjusted 655 sqft comparison size (after converting from harmonised to non-harmonised area), we can arrive at the following conclusion:
- A Q4 2029 rent band of ~$3.6k–$4.3k/month for a 655 sq ft 2-bed/2-bath is a reasonable scenario frame.
- That implies gross rental yields of ~2.9%–3.4% at the $1.498M band and ~2.4%–2.8% at the $1.7976M band (higher floors).
- When compared with the typical gross yields observed across the peer set, Pinery’s base-case yield appears to fall within the mainstream range for highly convenient East-side condominiums. However, it may not necessarily rank among the highest-yielding options. Instead, the investment appeal is likely to lie more in its strong convenience factors, sustained tenant demand, and the advantages of a modern, well-located development, rather than in headline yield alone.
Important note for readers: All yields shown are gross yields. Real net yield will be lower after vacancy, repairs, furnishings, agent fees, property tax, and condo maintenance fees.
Disclosure: This post is educational and analytical. It is not financial advice. Projections are scenarios based on the provided ProTrend 2BR graph values and an indicative price of $1,498,000 to $1,797,600 (as of this article). Actual rents, yields, and timelines may differ.
Article contributed by Jerry Wong.

Jerry Wong is a realtor at Propnex Realty, bringing a rich background in interior and lighting design to his work. He loves exploring diverse spaces and observing the transformative power of real estate. Beyond his professional role, Jerry finds his greatest fulfillment in connecting people with the right properties, gaining immense satisfaction from helping clients achieve their dreams.
Properties Highlighted In This Article




Let’s Discuss Your Property Plans
Interested in This Property?
Buying, selling or renting? Get a free consultation with realtors with a background in interior and lighting design. We’ll discuss your goals and help you assess your options—from pricing and timelines to layout practicality and space potential.
Share your contact details below, and we will get in touch to understand your needs and suggest the next steps. No pressure. No obligation to proceed.
Other Topics That May Interest You
Enquire About This Property
Check current availability and rental terms, arrange a viewing, or discuss whether the space could meet your business needs.
Share your requirements and we will get in touch. No obligation to proceed.