Site and tender outcome in context
The Telok Blangah Road site represents the first private residential GLS parcel released on the former Keppel Club/golf course land, positioning it as a critical “price and product benchmark” for the upcoming Greater Southern Waterfront (GSW) residential precinct. As the inaugural site, its eventual launch pricing, sales velocity, and buyer profile will likely serve as a reference point for subsequent GLS tenders in the area.

The site was launched for tender on 24 June 2025 and closed on 4 November 2025, with the award formally granted to Kingsford Huray Development Pte Ltd on 20 November 2025. The winning bid came in at S$918.3 million (approximately S$14,272 psm GFA), surpassing competing bids of S$880.0 million from the GuocoLand–Hong Leong consortium and S$863.26 million from the Frasers–Metro–Soilbuild consortium.
Tender Summary
Telok Blangah Road
($14,272.62)
From a market perspective, while the tender attracted only three bidders, the relatively narrow spread between bids suggests a strong alignment in developer underwriting assumptions. This indicates a shared conviction on the site’s long-term value despite prevailing macroeconomic uncertainties and the large capital outlay required.

Planning parameters and “hidden” cost drivers that affect breakeven pricing
Core planning numbers
The site is ~147,350 sq ft (≈13,689 sqm), 99-year leasehold, with a gross plot ratio of 4.7, implying a total GFA around ~692,550 sq ft (≈64,340 sqm).
A common market estimate is ~745 units, consistent with the GFA and plot ratio.

Design and engineering constraints that can raise the “all-in” development cost
Several requirements embedded in the tender materials matter because they can raise effective land cost (via additional works) and increase building cost (via constraints/complexity), even before we discuss fit-out quality.
The tender materials describe the precinct as part of a car-lite GSW area—notably with reduced parking provision, and extensive requirements for pedestrian/cycling links.
The site also carries staged road and access obligations (e.g., new access arrangements linked to the future road network), as well as covered linkways and cycling-path interfaces that require coordination with agencies and surrounding works.
The control plans also show an MRT 1st Reserve band running through the parcel, which is meaningful because it can constrain basement placement (which, in turn, affects parking layout and cost efficiency).

Building height zoning that shapes “view stacks” and pricing power
The control plans also prescribe differentiated height zones—i.e., this will not be a “uniform slab” development. A key implication is that some stacks can be engineered to capture better views (canal/green corridor/partial sea/city), while others will be more road-facing (Telok Blangah Road / West Coast Highway corridor) and likely marketed as the “value” stacks.
Converting the tendered land price to psf ppr and interpreting its implications
Land rate conversion to psf ppr
The PSF PPR can be replicated using the published bid and GFA:
- Tendered sale price: S$918,300,400
- Max permissible GFA: ~692,550 sq ft (≈64,340 sqm)
psf ppr = S$918,300,400 ÷ 692,550 sq ft ≈ S$1,326 psf ppr
Why “all-in land cost” can be meaningfully higher than the headline psf ppr
For feasibility, developers often consider more than the tender premium. Two important “land acquisition” add-ons are:
- Buyer’s Stamp Duty (BSD) applies to property acquisitions; IRAS states that from 15 Feb 2023, BSD for residential property is progressive up to 6% on the remaining amount above the earlier tiers.
- For housing developers acquiring sites for 5 or more residential units, IRAS indicates that the acquisition is subject to 40% ABSD, of which 35% may be remitted upfront (subject to conditions), while the remaining 5% is non-remittable.
Using IRAS’s BSD tiers (including the 6% top marginal rate from 15 Feb 2023) and the 5% non-remittable ABSD for housing developers, a rough “order-of-magnitude” uplift to effective land cost is plausible (exact duty depends on the stampable value and transaction structure). The key analytical point is: a headline S$1,326 psf ppr can become materially higher once unavoidable acquisition taxes and required infrastructure costs are internalised.
Comparable pricing and rents using two clusters around the site
Given the site’s position between Telok Blangah Road (and the emerging GSW residential precinct) and the Keppel Bay waterfront, direct comparability is inherently limited. It is, therefore, methodologically more robust to segment the analysis into two distinct clusters:
- A “waterfront-facing / Keppel Bay” cluster representing sea-facing amenity premium and HarbourFront adjacency.
- An “opposite side of Telok Blangah Road” cluster representing non-waterfront, more internal Telok Blangah / Wishart / Telok Blangah Drive living, albeit with very mixed tenure/age profiles.

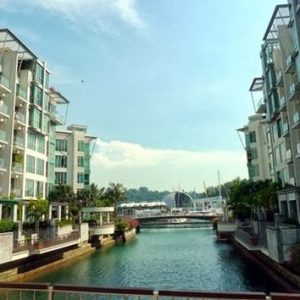
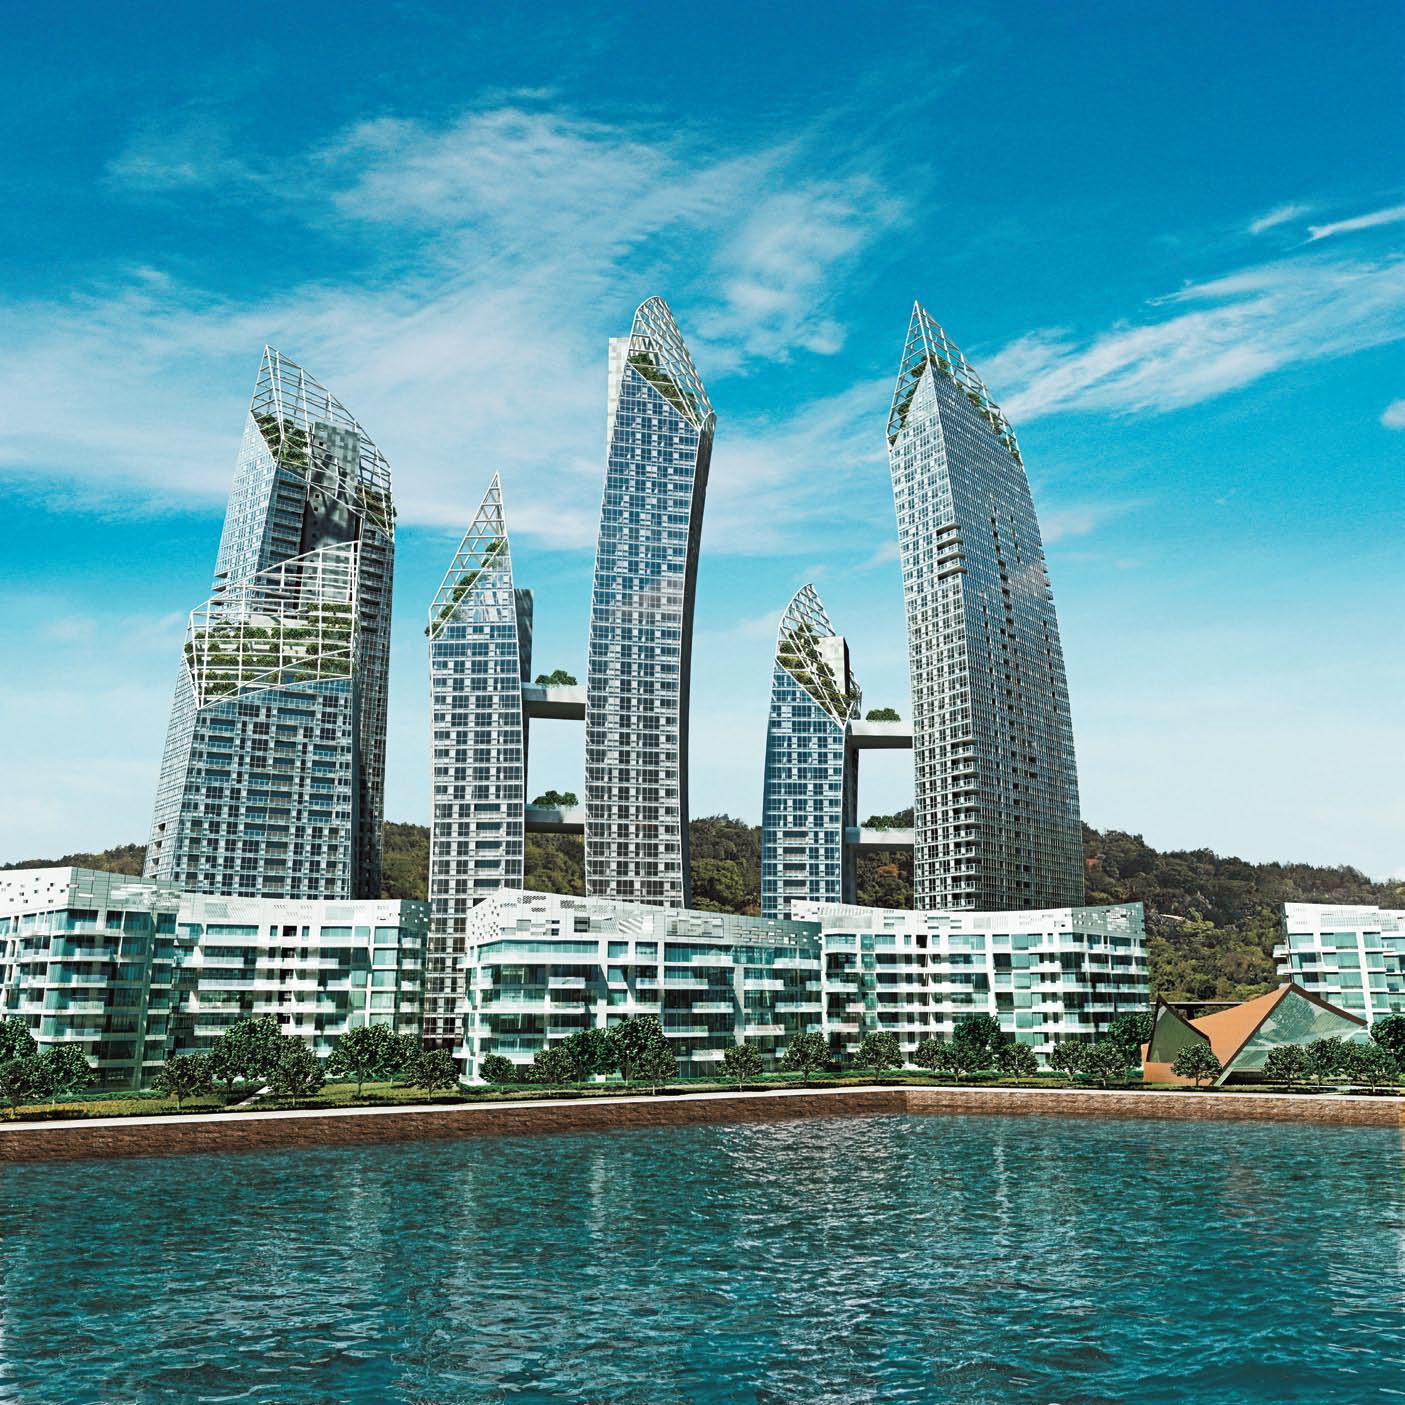
Waterfront-facing cluster: Reflections, Caribbean, Corals (Cluster 1)
Key project context:
- Reflections at Keppel Bay: 99-year leasehold, completed 2011, ~1,129 units.
- Caribbean at Keppel Bay: 99-year leasehold (from 1999), completed 2004, 969 units.
- Corals at Keppel Bay: 99-year leasehold, completed 2016, 366 units.
The attached PropNex ProTrend extracts (Quarterly, Q2 2024–Q1 2026) show the following 2-year-ish averages:


From the tables in those charts (same period):
- Reflections: ~S$1,753 psf resale average; ~S$5.39 psf/month rent average
- Caribbean: ~S$1,869 psf resale average; ~S$5.63 psf/month rent average
- Corals: ~S$2,092 psf resale average; ~S$6.43 psf/month rent average
A simple gross-yield proxy (monthly rent psf × 12 ÷ sale psf) implies gross yields in the ~3.6%–3.7% band for this Keppel Bay cluster (noting this is gross, not net of tax/maintenance/vacancy, and depends heavily on unit type). These yields are broadly consistent with the notion that older resale values can deliver higher yields than brand-new launches, even if absolute rents are strong.
Opposite side of Telok Blangah Road: Foresta, Harbour View Towers, Skyline Residences (Cluster 2)
Key project context (this cluster is structurally “messier”):
- The Foresta @ Mount Faber: freehold, completed 2014 (small development vs Keppel Bay mega-projects).
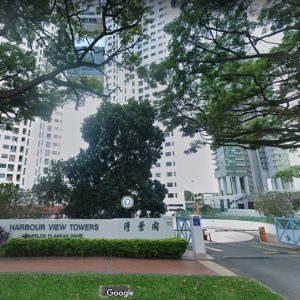
- Harbour View Towers (Telok Blangah Drive): 99-year leasehold (from 1990), completed 1994, 154 units.
- Skyline Residences: freehold, completed 2015, 283 units.
The attached PropNex ProTrend extracts show:


From those tables:
- The Foresta: ~S$1,969 psf resale average; ~S$5.94 psf/month rent average
- Harbour View Towers: ~S$1,654 psf resale average; ~S$4.09 psf/month rent average
- Skyline Residences: ~S$2,185 psf resale average; ~S$5.92 psf/month rent average
The gross-yield proxy for this cluster spans roughly 3.0% (Harbour View Towers) to 3.6% (Foresta), with Skyline around 3.3% (again: gross only, and unit mix drives outcomes).
What the two-cluster benchmark is really telling us
Two observations stand out when we treated the two clusters as “range anchors” rather than direct substitutes:
First, rents have converged more than prices. In both clusters, many averages sit around the mid- to high-S$5+ psf/month range (with Corals notably higher), suggesting that tenant willingness-to-pay is driven as much by the broader HarbourFront/GSW accessibility story as by pure ‘waterfront view’ alone, especially for smaller, efficiently sized units.
Second, tenure and age distort price comparisons in the inland cluster (freehold 2014/2015 stock mixed with 99-year 1994 stock). That is why the inland cluster can show resale psf that is not necessarily lower than the waterfront cluster, because Skyline (freehold, relatively newer) can command a higher resale psf than older 99-year waterfront stock in certain windows.
Estimating the future new-launch selling price, rents, and yield for the Kingsford Telok Blangah Road project
A land-cost-driven selling price model
A transparent way to use land cost is to solve for the required average selling price (ASP) given:
- Land cost (psf ppr and/or “all-in” land cost)
- Construction + soft costs
- A reasonable “saleable efficiency” (saleable area ÷ total GFA)
- Marketing and developer margin assumptions
Because this is a feasibility-style estimate, the output should be presented as a scenario range rather than a point forecast.
Key assumptions used
Saleable efficiency: Under condominium layouts, saleable (strata) area is typically materially below GFA because corridors, M&E space, and common areas consume floor area; harmonisation also alters how certain areas are counted (more on that below). A 0.75–0.78 saleable/GFA range is a reasonable sensitivity band for this type of high-rise project.
Construction and soft costs: For a high-rise, infrastructure-heavy parcel (car-lite works, linkways, road interfaces, site constraints), an illustrative S$550–S$600 psf of GFA construction cost band is used for modelling purposes (costs vary with specification, basement extent, façade, and contract market conditions).
Developer margin and selling costs: A combined 18% of revenue (e.g., 15% margin + ~3% marketing) is a common feasibility structure for scenarioing; actual underwriting varies by developer and market cycle.
Scenario results
Using the bid-derived land cost of S$1,326 psf ppr produces a “headline-only” breakeven-equivalent ASP in the low-to-mid S$3,000s psf.
If we also incorporate the idea that acquisition taxes can lift effective land cost (e.g., BSD tiers and developer ABSD treatment as described by IRAS), the implied ASP shifts upward and can plausibly land in the mid S$3,000s psf.
A practical consolidated forecast band (acknowledging uncertainty) is therefore:
Estimated new-launch ASP (blended): ~S$3,400 to S$3,700 psf with premium “best stacks” potentially higher and road-facing/value stacks potentially lower.
This band indicates that the project will launch at a substantial premium to older resale condos, as it is a new supply in an emerging GSW estate expected to mature structurally over the coming decade.
Rental outlook using the two clusters, adjusted for “newness vs view”
Because the new project is not a pure waterfront condominium like Corals/Caribbean/Reflections, but is also much newer than every comparable in both clusters, the cleanest approach is to forecast rent using:
- Base rent anchor near the cluster midpoint, then
- Add/subtract for (a) newness and (b) view/noise orientation
Given the attached cluster averages, an analytically defensible rent band is:
- Base rent expectation (blended project average): ~S$6.0 to S$6.6 psf/month
- Lower end: road-facing stacks + future competing supply
- Upper end: canal/Mount Fabel facing + higher floors + better outlook
This sits right between:
- Keppel Bay cluster averages (roughly mid-S$5s overall with Corals higher), and
- The opposite-side cluster averages (mid-S$5s overall, with Harbour View much lower).
This is also consistent with historical transaction data, which show that rentals at Reflections at Keppel Bay have generally transacted in the mid-S$5 psf to above S$6 psf range, depending on unit type and specific development characteristics.

Yield implication for a new launch: likely lower than older resale yields
If the project sells around S$3,400–S$3,700 psf and rents around S$6.0–S$6.6 psf/month, the implied gross rental yield is approximately:
- Low case: (6.0 × 12) ÷ 3,700 ≈ 1.9%
- Mid case: (6.3 × 12) ÷ 3,500 ≈ 2.1%
- High case: (6.6 × 12) ÷ 3,400 ≈ 2.3%
So a reasonable expectation is:
Estimated gross yield at launch pricing: ~2.0% to ~2.4%
This is structurally lower than the ~3%–3.7% gross-yield proxies derived from the older resale comparables, because new launches typically price in more capital-growth optionality (and newness), while rents adjust more slowly.
Harmonised floor-area regulations and how they affect our psf comparisons
Given that this site falls under URA’s harmonised floor area framework, this distinction is critical, as “psf” comparability ultimately depends on the underlying measurement methodology.
URA (with SLA, BCA, SCDF) issued a joint circular stating the key harmonisation changes, including that:
- All agencies’ floor areas will be measured to the middle of the wall
- All strata areas will be included as GFA
- All voids will be excluded from the strata area
- The revised definitions apply to development applications submitted on or after 1 Jun 2023, and also to GLS sites launched on or after 1 Sep 2022.
This matters for our analysis because:
The Telok Blangah Road GLS (launched June 2025) is in scope for the harmonised regime, whereas the older comparables were approved and built under pre-harmonisation norms. Therefore, even if two homes offer similar “felt usable space,” their reported strata area and computed GFA relationships can differ, which means:
- A “S$X psf” in an older project may not be directly comparable to a “S$X psf” in a harmonised project without understanding what was counted/excluded.
- Developers may respond by reducing non-functional spaces (e.g., voids) and rebalancing layouts to preserve value under the new counting regime.
In this context, the cluster-based comparisons should be interpreted as a framework for assessing pricing power and market positioning, rather than as a direct, mechanical benchmark that implies the new development must transact at a fixed premium over existing projects.
Expected impact on surrounding projects and the adjacent HDB Berlayar estate
Competitive impacts on existing private condos
The Kingsford project will likely move the local market through two phases:
Pre-launch and launch phase (marketing years): The project’s announced pricing and product narrative (“first private in Berlayar / GSW”) can psychologically re-anchor what buyers consider “fair value” for District 4 city-fringe living near HarbourFront and Telok Blangah MRT. This often widens the price gap between new launch and resale, which can paradoxically support resale liquidity (buyers priced out of new launch look for nearby substitutes, especially for larger formats).
Post-TOP leasing phase (around URA’s expected 2030 completion window): When a large new project enters the rental pool, it can increase competition for tenants, especially for older developments that compete on similar commute patterns but cannot match new facilities/finishes.
Because this GLS site is not pure “seafront”, the most direct competitive pressure will likely be on:
- Older resale condos whose main differentiator is “being near HarbourFront” rather than “having true seafront stacks,” and
- Projects with older specifications are facing renovation “capex” decisions.
True seafront stacks in the Keppel Bay cluster can retain a differentiated premium, but the new project may still siphon demand from buyers/tenants who prioritise newness and the GSW masterplan trajectory over direct sea view.
Interaction with HDB Berlayar Residences and the broader Berlayar estate supply
HDB has indicated that the GLS site sits in close proximity to the first BTO project in the area—Berlayar Residences (approximately 870 units)—which was reported to be about 4 to 5 times oversubscribed during the October BTO exercise.
This is relevant to private residential pricing for three key reasons:
1. The amenity flywheel
A sizeable HDB population typically accelerates the rollout of public amenities, transport connectivity, and retail/community infrastructure. Over time, this enhances the precinct’s overall liveability, supporting both resale values and rental demand for nearby private developments—even if some private buyers may place a premium on exclusivity.
2. The upgrader pipeline
Over the medium term, a large base of BTO homeowners can evolve into a meaningful upgrader pool post-MOP. This creates a natural demand funnel for mass-market and mid-tier private housing within the same neighbourhood.
3. The supply overhang consideration
The broader former Keppel golf course site is slated to deliver a substantial volume of housing across both public and private segments. While the first GLS parcel benefits from initial scarcity and first-mover positioning, the longer-term pipeline introduces a supply dynamic that could temper pricing power if multiple similar projects are launched into a shared demand base.
Bottom line for “impact”
Net-net, the Kingsford Telok Blangah Road GLS is poised to play a pivotal role across multiple time horizons. In the near term, it is likely to act as the key price benchmark for private residential developments within the Berlayar and wider Greater Southern Waterfront (GSW) precinct. Over the medium term, it should support resale values in the surrounding area by drawing market attention and establishing a new pricing reference point.
However, in the long term, the project is also expected to introduce competitive pressure on the rental market. As more private developments within the GSW precinct are completed and enter the leasing pool, the increase in supply could compress rental yields—unless there is a corresponding and sustained uplift in rental demand across the area.
Disclosure: This post is for educational and analytical purposes. It is not financial advice. Projections are based on the provided ProTrend graph values, our inferred prices and comparability assumption, and indicative prices (accurate as of 12th April 2026). Actual construction costs, timelines, and market conditions may vary.
Article contributed by Jerry Wong.

Jerry Wong is a realtor at Propnex Realty, bringing a rich background in interior and lighting design to his work. He loves exploring diverse spaces and observing the transformative power of real estate. Beyond his professional role, Jerry finds his greatest fulfillment in connecting people with the right properties, gaining immense satisfaction from helping clients achieve their dreams.