On rental fundamentals alone, The Robertson Opus looks investable, but the attractiveness is concentrated in the smaller units and lower-priced floors rather than being uniform across the project.
Our central estimate, based on the September 2026 rental-market dollars, is:
| Unit Type | Size | Estimated rent today-equivalent | Estimated rent psf | Gross yield on discounted price |
| Stack 34 — Suite | 431 sq ft | $3,800–$4,200, base $4,000 | $8.82–$9.74 | 3.61–3.73% base, depending on floor |
| Stack 41 — 1BR | 495 sq ft | $4,400–$4,900, base $4,650 | $8.89–$9.90 | 3.64–3.70% base |
| Stacks 16/17 — 2BR, pool-facing | 721 sq ft | $6,000–$6,500, base $6,250 | $8.32–$9.02 | 3.18–3.33% base |
| Stack 20 — 2BR, outward/Unity Street | 721 sq ft | $5,800–$6,300, base $6,050 | $8.04–$8.74 | 3.12–3.34% base |
| Stack 39 — 2BR, low-floor outward | 721 sq ft | $5,700–$6,100, base $5,900 | $7.91–$8.46 | 3.25% base |
These estimates are deliberately anchored to the current achieved rental market, not to an aggressive 2029 forecast. The developer presently targets TOP in the first half of 2029, so actual first-leasing rents are several years away.
The strongest income cases are consequently Stack 34 followed very closely by Stack 41. The 431 sq ft Suite has the highest projected gross yield because it converts a relatively low absolute purchase price into a rental quantum that Robertson Quay’s singles/couple tenant pool can plausibly absorb. The 495 sq ft 1-bedroom is almost as attractive and, in our view, probably the better risk-adjusted rental product because it has a true separate bedroom and a pool-facing location.
Among the 2BRs, #02-17 is our preferred rental-oriented buy. #02-20 technically produces a fractionally higher estimated yield, but #02-17 has the inward pool/courtyard orientation and costs only $2.255 million. The projected difference in yield between the two is essentially immaterial; tenant appeal may therefore favour #02-17.
Most importantly, the neighbouring data do not show that freehold or long tenure itself generates higher rents. In this nine-project sample, the average project-level rent for the freehold/929-year group is approximately $5.84 psf/month, versus approximately $5.85 psf/month for the two 99-year projects. That near-perfect equality is partly coincidence, and the 99-year sample is only two projects, but it reinforces the economic intuition: tenants pay for the home they occupy, its condition, size, view, facilities and location; they generally do not pay a monthly premium because the landlord owns a longer lease. The surrounding achieved-rental data strongly support that conclusion.
That makes The Robertson Opus’s 999-year tenure much more relevant to Part Two — purchase price, exit value and long-run capital preservation — than to Part One’s rental level.

Discounted Units At A Glance
The selected discounted units comprise a 431 sq ft Suite, a 495 sq ft 1 Bedroom and several 721 sq ft 2 Bedroom configurations.
| Stack | Unit Type | Stated Area |
|---|---|---|
| 34 | Suite S1a | 431 sq ft / 40 sqm |
| 41 | 1 Bedroom A1 | 495 sq ft / 46 sqm |
| 39 | 2 Bedroom B1 | 721 sq ft / 67 sqm |
| 16 | 2 Bedroom B4 | 721 sq ft / 67 sqm |
| 17 | 2 Bedroom B4 | 721 sq ft / 67 sqm |
| 20 | 2 Bedroom B5 | 721 sq ft / 67 sqm |
From the latest prices, Stack 34 represents an investment of roughly S$1.29 million for the 431 sq ft Suite, while Stack 41 is approximately S$1.51 million for the larger 495 sq ft 1 Bedroom. This distinction is important when assessing potential rents, rental yields and the relative investment merits of the two unit types.
Importantly, Robertson Opus is a non-GFA-harmonised development. This means its unit areas are measured under the earlier framework, rather than the GFA harmonisation rules introduced for qualifying development applications from 1 June 2023. As a result, the stated strata area should not be read as purely internal living space. Depending on the unit, the quoted square footage may include areas such as balconies, PES and air-conditioner ledges. This distinction matters when comparing Robertson Opus with newer GFA-harmonised projects, as two units with the same stated size may not provide the same amount of usable internal space.
Another relevant distinction is that the selected second-floor units are the patio/PES variants of their respective layouts. Their stated areas remain 431 sq ft, 495 sq ft or 721 sq ft depending on the unit type, but the configuration of their outdoor space differs from the conventional balcony versions on the upper floors.
Facing of the selected stacks
The Robertson Opus site plan provides sufficient information to show us the principal orientation of each unit’s living room and balcony. Because the blocks are positioned at an angle within the site, treat the directions below as approximate orientations rather than precise survey bearings.
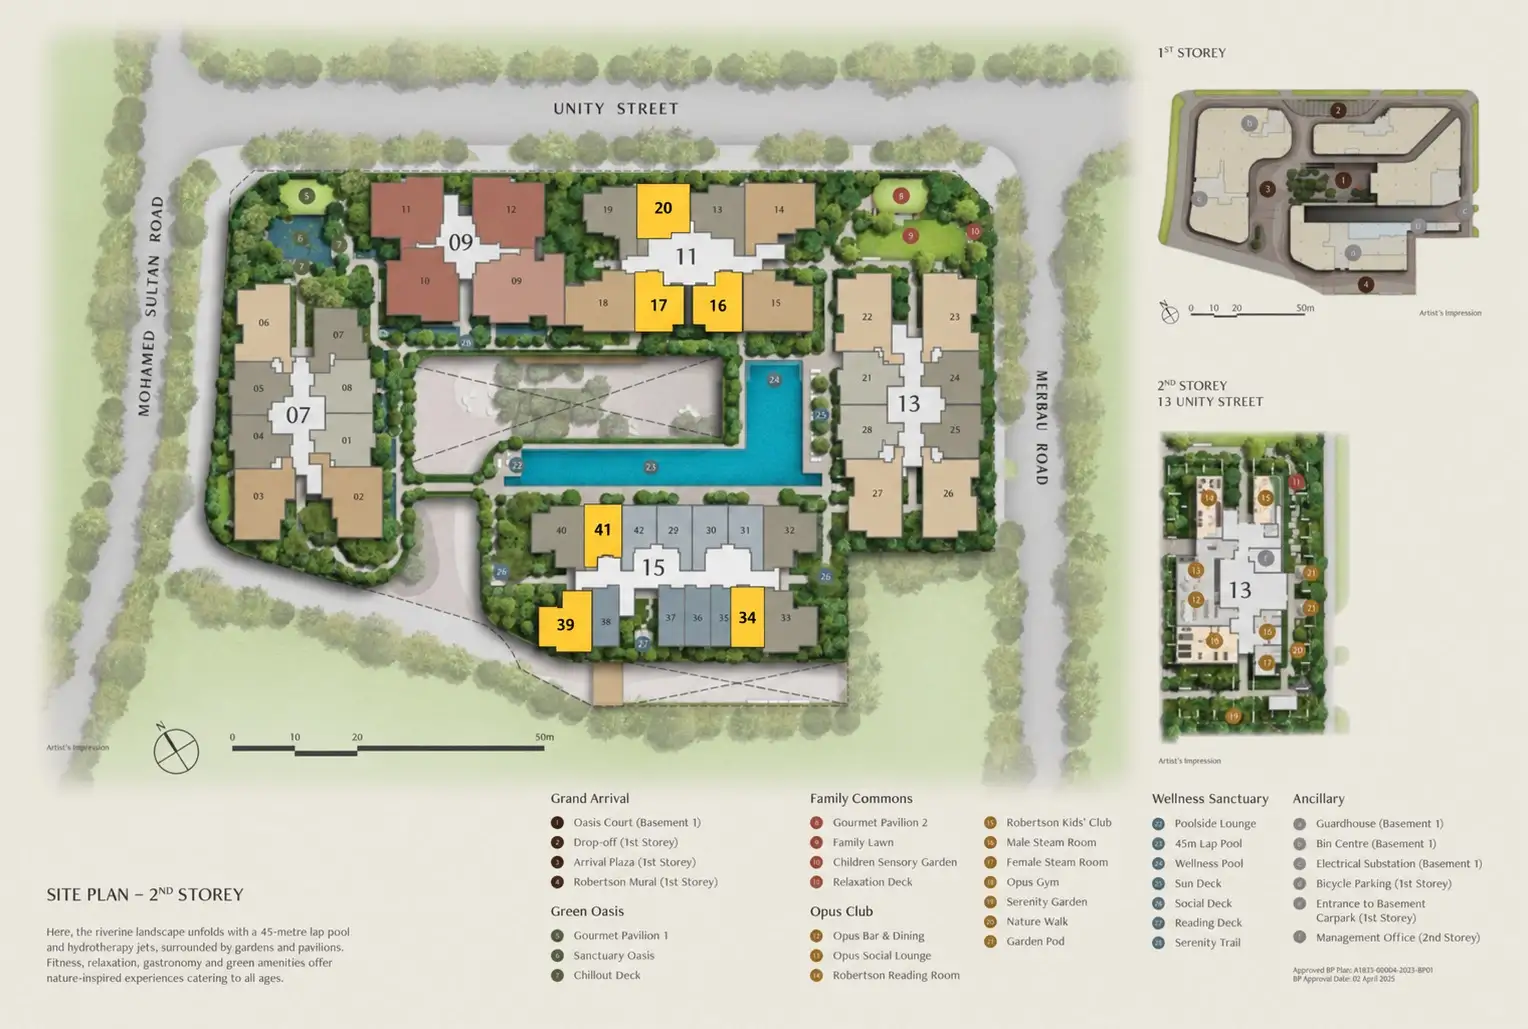
| Stack | Approximate facing | What it looks toward | Rental implication |
| 20 | North-east | Outward toward Unity Street / landscaped perimeter | Less inward-facing privacy benefit; potentially less harsh western afternoon exposure. We model a slightly lower rent than pool stacks. |
| 16 | South-west | Inward toward the pool / central landscape | Attractive lifestyle view; likely to have greater tenant appeal, offset partly by possible afternoon sun. |
| 17 | South-west | Inward toward the pool / central landscape | Similar to Stack 16 and arguably the best 2-bedroom rental proposition among the discounted units. |
| 39 | Roughly west–south-west | Outward toward the Grand Arrival / Mohamed Sultan side | #02 only; lower floor and arrival/perimeter orientation warrant a more conservative rent assumption. |
| 34 | South-west | Outward toward Grand Arrival / southern perimeter | Less desirable than inward Stack 41 for a rental-oriented small unit; potential afternoon sun and arrival activity. |
| 41 | North-east | Inward toward the central pool/landscape | In our view, the best small-unit facing is the discounted pool. |
These directions refer primarily to the orientation of the living room and balcony and are inferred from the site plan rather than stated as official facing descriptions. Because the development and individual blocks are angled, assigning exact compass bearings would imply a level of precision that the site plan does not provide.
What Robertson Quay rents are actually showing
For consistency, the most useful baseline is the project-level average rental psf, based on PropNex’s Investment Suite extraction of URA rental data from the previous 24 months.
| Development | Tenure/completion | Scale | Unit-size character | 24-month avg achieved rent* | Indicative gross rental yield* |
| The Quayside | 99-year from 1994 / 1998 | 79 units | Very large: 2BR begins around 1,130 sq ft | 2 Bedroom $3.91 – $5.30 psf pm |
2 Bedroom 3.23% |
| UE Square | 929 years from 1953 / 1997 | 495 units | Wide mix; compact 506 sq ft 1BRs exist alongside large family homes | 1 Bedroom $3.68 – $8.18 psf pm 2 Bedroom $3.36 – $6.33 psf pm |
1 Bedroom 2.92% 2 Bedroom 2.72% |
| Watermark Robertson Quay | Freehold / 2008 | 206 units | 2BR roughly 883–1,141 sq ft | 2 Bedroom $4.74 – $6.84 psf pm |
2.87% |
| Robertson 100 | Freehold / 2004 | 186 units | 1BR from ~678 sq ft; 2BR ~872 sq ft upward | 1 Bedroom $4.53 – $7.54 psf pm 2 Bedroom $4.11 – $6.71 psf pm |
1 Bedroom No Sale. No Data. 2 Bedroom 2.89% |
| The Pier at Robertson | Freehold / 2006 | 201 units | Relatively compact for its era; current 1BR examples ~657–893 sq ft | 1 Bedroom $4.35 – $8.18 psf pm 2 Bedroom $3.79 – $7.14 psf pm |
1 Bedroom 3.23% 2 Bedroom 2.88% |
| 8 Rodyk | Freehold / 2011 | 50 units | Boutique; 721 sq ft 1BR exists, larger family units above that | 1 Bedroom $5.47 – $6.53 psf pm 2 Bedroom $4.78 – $5.92 psf pm |
1 Bedroom No Sale. No Data. 2 Bedroom 2.8% |
| Robertson Blue | Freehold / 2006 | 36 units | Very low density; large-format homes, e.g. 1,238 sq ft 2BR | 2 Bedroom $4.83 – $8.44 psf pm |
2.89% |
| Rivergate | Freehold / 2009 | 545 units | Large luxury format: 2BR starts around 1,023 sq ft | 2 Bedroom $6 – $8.48 psf pm |
2.86% |
| Up@Robertson Quay | 99-year from 2011 / 2015–16 | 70 units | Compact/loft: 1BR 463–614 sq ft, 1+study 527–743 | 1 Bedroom $5.23 – $10.22 psf pm 2 Bedroom $4.61 – $6.47 psf pm |
1 Bedroom 4.41% 2 Bedroom 3.6% |
*Data extracted from PropNex Investment Suite APP
What actually determines rent around Robertson Quay?
Even within the same bedroom category, achieved rents can vary enormously.
For one-bedroom apartments, the 24-month ranges run from $3.68–$8.18 psf per month at UE Square to $5.23–$10.22 psf at UP @ Robertson Quay.
For two-bedroom apartments, the dispersion is even more striking. The Quayside records $3.91–$5.30 psf, while RiverGate reaches $6.00–$8.48 psf and Robertson Blue has transactions as high as $8.44 psf.
That means using a simple neighbourhood average and applying it to The Robertson Opus would be misleading.
Instead, the surrounding projects fall into several useful rental clusters.
Cluster 1: compact apartments with high rental psf
The most relevant examples are UP @ Robertson Quay, the smaller units at The Pier at Robertson, and some of the compact stock at UE Square.
UP @ Robertson Quay is particularly relevant because its compact one-bedroom apartments, ranging from approximately 463 to 614 sq ft, provide a useful benchmark for Robertson Opus. Over the past 24 months, its achieved 1-bedroom rental range is:
$5.23–$10.22 psf per month.
Its indicative 1BR gross rental yield is also 4.41%, the highest among the comparable one-bedroom projects in the table.
Compare that with Robertson 100, where one-bedroom apartments start at roughly 678 sq ft. Its achieved range is $4.53–$7.54 psf.
The Pier, with one-bedroom examples around 657–893 sq ft, records $4.35–$8.18 psf.
The relationship makes economic sense.
A tenant does not normally begin with a rental psf calculation. The tenant begins with a monthly housing budget.
Consequently, a well-designed 500 sq ft apartment can command substantially more rent per square foot than a 900 sq ft apartment because doubling the floor area does not double what the same tenant is prepared to pay each month.
This is highly relevant to The Robertson Opus.
Its compact unit formats mean that its rental psf should not be benchmarked against the larger apartments at Watermark, The Quayside or RiverGate.
Cluster 2: traditional larger-format Robertson Quay apartments
The second cluster consists primarily of The Quayside, Watermark Robertson Quay and Robertson 100, together with portions of The Pier. These developments contain substantially larger apartments than the compact formats being introduced at Robertson Opus.
The Quayside is the extreme example.
Its two-bedroom apartments begin at approximately 1,130 sq ft, and its achieved 2 bedroom rental range is only:
$3.91–$5.30 psf per month.
Watermark’s roughly 883–1,141 sq ft 2BRs achieve:
$4.74–$6.84 psf.
Robertson 100’s 2BRs, beginning around 872 sq ft, achieve:
$4.11–$6.71 psf.
These are useful comparables for determining the absolute monthly rent cheque Robertson Quay tenants are prepared to pay, but they are less useful as direct psf benchmarks for a compact Robertson Opus 2-bedroom unit.
A 721 sq ft Robertson Opus apartment does not need to achieve the same psf as a 1,100 sq ft Quayside apartment to compete for the same tenant.
In fact, it probably should not.
If a 1,130 sq ft apartment rents at $5.00 psf, the monthly rent is already $5,650.
A new 721 sq ft apartment renting at $8.00 psf would cost $5,768 per month.
From the tenant’s perspective, those apartments therefore occupy surprisingly similar monthly budgets even though one appears dramatically more expensive on a psf basis.
This is why you must consider absolute rent alongside rental psf.
Cluster 3: premium riverfront and luxury projects
RiverGate, Robertson Blue and, to some extent, 8 Rodyk show why apartment size alone cannot explain rental performance.
RiverGate’s two-bedroom apartments start around 1,023 sq ft, yet its achieved 2 bedroom rental range is impressive:
$6.00–$8.48 psf per month.
That is significantly above Watermark and The Quayside despite RiverGate’s large apartments.
Robertson Blue is even more interesting. Its large-format 2BR apartments include examples around 1,238 sq ft, yet its achieved range reaches:
$4.83–$8.44 psf.
The sample should be interpreted with some caution given the development’s small size of just 36 apartments, but the results still illustrate an important underlying principle.
Large apartments do not necessarily mean low rental psf when the product, location, view or tenant positioning is sufficiently differentiated.
RiverGate is probably the strongest example of this phenomenon within the selected projects.
It suggests that tenants will pay more for a differentiated residential experience even within the same Robertson Quay micro-market.
Tenure is unimportant to tenants
The comparison also tests one of the central questions surrounding Robertson Opus: how much rental value does its 999-year tenure actually create?
The evidence suggests: very little directly.
Consider the one-bedroom market.
- UP @ Robertson Quay is a 99-year development, yet its achieved 1-bedroom range of $5.23–$10.22 psf is the strongest in the selected comparison.
- UE Square has a 929-year tenure, yet its 1-bedroom transactions span $3.68–$8.18 psf.
The same pattern appears in indicative yields.
UP @ Robertson Quay records approximately:
- 4.41% for 1-bedroom
- 3.60% for 2-bedroom
Meanwhile, many of the freehold projects sit below 3% for their relevant two-bedroom units:
- Watermark: 2.87%
- Robertson 100: 2.89%
- The Pier: 2.88%
- 8 Rodyk: 2.80%
- Robertson Blue: 2.89%
- RiverGate: 2.86%
This does not mean leasehold property is inherently superior for rental investment. Rental yield is a ratio of rent to purchase price, so a lower capital value can produce a higher yield.
It does, however, reinforce an important distinction between owner value and tenant value. Tenure can matter greatly to an owner because it affects the asset’s duration and potential resale characteristics.
A tenant signing a two-year lease generally receives no corresponding benefit from the landlord owning a 99-year, 999-year or freehold interest.
For Robertson Opus, therefore, the 999-year tenure should not be built into the rental forecast as a meaningful rental premium.
That question belongs much more naturally in Part 2, when we examine purchase prices.
Age and product quality are considerably more important
Older traditional projects frequently occupy the lower end of the rental-psf spectrum, while compact and/or better-positioned projects extend much further into the upper ranges.
But age should not be considered in isolation.
Renovation, layout, view, furnishings, floor, condition and unit size all influence individual rental contracts. The very wide ranges within UE Square — $3.68–$8.18 psf for 1-bedroom units and $3.36–$6.33 psf for 2-bedroom units — demonstrate how much variation can exist inside a single development.
That observation is actually more useful than trying to calculate a correlation coefficient from nine projects.
It tells us that the apartment itself matters almost as much as the condominium name.
Robertson Opus will have one obvious advantage when it enters the leasing market: every apartment will be new at first.
New kitchens, bathrooms, appliances, common facilities, and finishes can matter to tenants because they experience them every day. Its 999-year tenure is invisible to them.
What does this mean for Robertson Opus?
The relevant rental hierarchy is therefore not:
Freehold/999-year > leasehold.
Nor is it:
Larger Development Size > Smaller Development Size.
The surrounding evidence instead points toward something closer to:
absolute monthly rent + unit efficiency + project condition + view/facing + facilities + location/convenience + unit presentation.
For Robertson Opus, this means that the smaller units should naturally operate at a higher rental psf than traditional 900–1,200 sq ft Robertson Quay apartments because their absolute monthly rents remain manageable.
At the same time, the project will enter the market as brand-new stock.
That creates a credible case for Robertson Opus to trade toward the upper portion of the existing comparable ranges, rather than around their midpoint.
But it would be too aggressive to assume that every Robertson Opus apartment will immediately establish a new rental record.
The development will also include 348 apartments. If a meaningful number are investor-owned and enter the rental market around the same time after TOP, landlords may initially compete with one another.
The new-build premium and the new-supply effect therefore work in opposite directions.
Estimating the Robertson Opus rents
Based on the latest comparable rental data, we would adopt relatively conservative rental assumptions for The Robertson Opus rather than simply extrapolating from the highest rental psf achieved by neighbouring developments.
| Robertson Opus unit | Working rent | Approx. rental psf |
|---|---|---|
| Suite — Stack 34 | $4,000/month | $9.30 psf on 431 sq ft |
| 1BR — Stack 41* | $4,650/month | $9.40 psf on 495 sq ft |
| 2BR — Stack 20 | $6,050/month | $8.39 psf on 721 sq ft |
| 2BR — Stack 16* | $6,250/month | $8.67 psf on 721 sq ft |
| 2BR — Stack 17* | $6,250/month | $8.67 psf on 721 sq ft |
| 2BR — Stack 39 | $5,900/month | $8.18 psf on 721 sq ft |
*A higher rental psf is assigned to these stacks to reflect their internal/pool-facing orientation.
The key question is whether these assumptions are reasonable when set against the latest 24-month achieved-rent ranges.
For the Suite and 1-bedroom units, the proposed $9.30–$9.40 psf sits toward the upper end of the existing market, but it has precedent. UP @ Robertson Quay has achieved 1-bedroom rents of $5.23–$10.22 psf per month, while UE Square and The Pier at Robertson have both recorded 1-bedroom rents as high as $8.18 psf. Our assumption for The Robertson Opus therefore requires a premium over the upper end achieved at most of the older neighbouring projects, but remains below the highest 1-bedroom psf already recorded at UP @ Robertson Quay.
The premium is being underwritten on the basis that Robertson Opus will enter the market as a brand-new product, with contemporary finishes and facilities, while the selected Stack 41 also benefits from an internal/pool-facing orientation. Nevertheless, at $9.30–$9.40 psf, there is less room for execution error than with a more conservative $8-plus psf assumption. These rents should therefore be viewed as upper-market but supportable underwriting assumptions, rather than neighbourhood-average rents.
The rental assumptions for the 2-bedroom units warrant closer assessment. At approximately $8.18–$8.67 psf, our assumption will require The Robertson Opus to perform at or around the very top of the selected 2-bedroom market. RiverGate has achieved $6.00–$8.48 psf, while Robertson Blue has achieved $4.83–$8.44 psf. By comparison, The Pier tops out at $7.14 psf, Watermark at $6.84 psf, Robertson 100 at $6.71 psf and UP @ Robertson Quay at $6.47 psf.
This means the $5,900 assumption for Stack 39, equivalent to $8.18 psf, is already a premium-market assumption, albeit one supported by achieved transactions at RiverGate and Robertson Blue. Stack 20 at $8.39 psf sits even closer to the observed ceiling.
The $8.67 psf assumptions for pool-facing Stacks 16 and 17 are the most demanding. They are slightly above the highest 2-bedroom psf in our comparison table—RiverGate’s $8.48 psf and Robertson Blue’s $8.44 psf. The additional premium is therefore being attributed to Robertson Opus being newer and to the more desirable internal/pool-facing orientation, rather than being directly demonstrated by today’s comparable transactions.
Overall, the smaller-unit assumptions have stronger precedent, with compact 1-bedroom units at UP @ Robertson Quay having already achieved rents above $10 psf. The 2-bedroom assumptions face a higher underwriting hurdle: Stacks 20 and 39 would need to perform close to the strongest existing 2-bedroom contracts in the neighbourhood, while the $8.67 psf assumed for Stacks 16 and 17 sits modestly above the current comparable ceiling.
That said, the higher psf assumptions for Robertson Opus’s 2-bedroom units are driven primarily by their smaller 721 sq ft format. Most of the surrounding 2-bedroom comparables are substantially larger, so comparing rental psf alone can be misleading. Tenants ultimately rent based partly on the absolute monthly rental quantum, and a smaller unit can command a higher psf while still remaining competitive on total monthly rent. In other words, the $8-plus psf underwriting does not necessarily imply that Robertson Opus must command an equivalent premium in absolute rent; it partly reflects the mathematical effect of spreading a competitive 2-bedroom rental quantum over a smaller floor area.
The Suite — Stack 34
Stack 34 deserves particular attention because its $1.288 million starting discounted price gives it the highest income returns among the selected smaller apartments.
At an assumed $4,000 monthly rent:
Gross Yield=($4,000×12)/Purchase Price
That produces:
| Unit | Discounted price | Base rent | Gross yield |
|---|---|---|---|
| #02-34 | $1,288,000 | $4,000 | 3.73% |
| #03-34 | $1,288,000 | $4,000 | 3.73% |
| #04-34 | $1,294,000 | $4,000 | 3.71% |
| #05-34 | $1,300,000 | $4,000 | 3.69% |
| #06-34 | $1,307,000 | $4,000 | 3.67% |
| #07-34 | $1,313,000 | $4,000 | 3.66% |
| #08-34 | $1,325,000 | $4,000 | 3.62% |
| #09-34 | $1,331,000 | $4,000 | 3.61% |
As a Suite, Stack 34 occupies a somewhat different rental niche from a conventional 1-bedroom apartment.
It will likely appeal primarily to tenants who prioritise location, finish, and convenience over internal space. This can still be an attractive rental segment because such tenants often think in terms of a maximum monthly budget rather than rental psf alone.
The key risk here is therefore not simply whether the unit can justify its rental psf. It is tenant resistance to the actual usable internal area.
This matters particularly at Robertson Opus because the project is non-GFA-harmonised. Strata area remains useful for comparison with older non-harmonised developments, but the amount of genuinely usable enclosed living space still matters to a tenant standing inside the apartment.
That is why the Suite should ultimately be tested against competing apartments within a similar monthly rental budget, rather than only against nominal bedroom categories.
The 1 Bedroom — Stack 41
At the assumed $4,650 per month, the discounted prices produce:
| Unit | Discounted price | Base rent | Gross yield |
|---|---|---|---|
| #02-41 | $1,508,000 | $4,650 | 3.70% |
| #03-41 | $1,508,000 | $4,650 | 3.70% |
| #04-41 | $1,516,000 | $4,650 | 3.68% |
| #05-41 | $1,532,000 | $4,650 | 3.64% |
The comparison with UP @ Robertson Quay is particularly useful here.
UP’s 1-bedroom units have achieved $5.23–$10.22 psf per month, with an indicative gross rental yield of 4.41%. This provides some precedent for compact 1-bedroom apartments in the Robertson Quay area achieving high rental psf.
Robertson Opus’s assumed $4,650 monthly rent should therefore be understood in the context of its compact format and new-build positioning. The smaller floor area naturally pushes the rental psf higher even when the absolute monthly rent remains within the budget of tenants looking for a centrally located 1-bedroom apartment.
Its projected gross yield, however, remains below UP @ Robertson Quay’s indicated 4.41%.
That distinction matters.
Robertson Opus may command a higher absolute rent because it is newer, but it may not produce the highest rental yield because investors are also paying substantially more capital for that new product.
That is precisely why rental performance and purchase price need to be analysed separately.
The 2 Bedroom units
The achieved-rent evidence is:
| Comparable | 24-month achieved 2BR rent |
|---|---|
| The Quayside | $3.91–$5.30 psf |
| UE Square | $3.36–$6.33 psf |
| Watermark | $4.74–$6.84 psf |
| Robertson 100 | $4.11–$6.71 psf |
| The Pier | $3.79–$7.14 psf |
| 8 Rodyk | $4.78–$5.92 psf |
| Robertson Blue | $4.83–$8.44 psf |
| RiverGate | $6.00–$8.48 psf |
| UP @ Robertson Quay | $4.61–$6.47 psf |
Our underwriting assumption of $5,900–$6,250 per month places the selected Robertson Opus 2-bedroom units near the upper end of the existing achieved rental market on a psf basis.
However, this needs to be viewed in the context of their smaller 721 sq ft layouts. Many of the surrounding 2-bedroom comparables are substantially larger, so Robertson Opus can achieve a higher rental psf without requiring an equally large premium in absolute monthly rent. In other words, part of the apparent psf premium is simply a function of fitting a competitive 2-bedroom rental quantum into a smaller floor area, rather than being entirely attributable to its new-project status.
We would therefore treat $5,900–$6,250 per month as a reasonable base underwriting range, while still re-testing achievable rents closer to TOP as actual competing supply, unit condition and tenant response become clearer.
Yield across the 2-bedroom choices
Using those rent assumptions:
| Unit | Price | Rent | Gross yield |
|---|---|---|---|
| #02-20 | $2,175,000 | $6,050 | 3.34% |
| #03-20 | $2,190,000 | $6,050 | 3.32% |
| #04-20 | $2,206,000 | $6,050 | 3.29% |
| #05-20 | $2,236,000 | $6,050 | 3.25% |
| #06-20 | $2,251,000 | $6,050 | 3.23% |
| #07-20 | $2,266,000 | $6,050 | 3.20% |
| #08-20 | $2,296,000 | $6,050 | 3.16% |
| #09-20 | $2,312,000 | $6,050 | 3.14% |
| #10-20 | $2,327,000 | $6,050 | 3.12% |
| #02-16 | $2,295,000 | $6,250 | 3.27% |
| #03-16 | $2,295,000 | $6,250 | 3.27% |
| #04-16 | $2,311,000 | $6,250 | 3.25% |
| #05-16 | $2,341,000 | $6,250 | 3.20% |
| #06-16 | $2,356,000 | $6,250 | 3.18% |
| #02-17 | $2,255,000 | $6,250 | 3.33% |
| #03-17 | $2,285,000 | $6,250 | 3.28% |
| #04-17 | $2,300,000 | $6,250 | 3.26% |
| #02-39 | $2,176,000 | $5,900 | 3.25% |
An important difference exists between these numbers and the comparable-project yield table. The surrounding-development yields are observed indicative market yields derived from existing sales/rental evidence.
The Robertson Opus figures are forward-looking underwriting yields based on estimated rents and today’s discounted purchase prices.
The floor premium problem
Tenants may pay for height, but investors need to be careful not to pay substantially more for height than tenants will.
Stack 20 demonstrates the issue particularly clearly.
#02-20 costs $2.175 million. #10-20 costs $2.327 million.
The buyer is therefore paying another $152,000, or approximately 7%, to move from the second to the tenth floor.
If #02 rents for $6,050, #10 would need approximately:
$6,470 per month
simply to maintain approximately the same gross yield.
In other words, the eighth-floor difference needs to generate roughly $420 of additional rent every month.
That is possible if the higher unit gains a genuinely superior outlook. But you shouldn’t assume it just because the unit number is higher.
The hurdle is considerably smaller elsewhere:
| Stack | Price increase across selected floors | Approx. additional monthly rent required to preserve starting yield |
|---|---|---|
| 20: #02 → #10 | ~7.0% | ~$420 |
| 16: #02 → #06 | ~2.7% | ~$165 |
| 17: #02 → #04 | ~2.0% | ~$125 |
| 34: #02 → #09 | ~3.3% | ~$130 |
| 41: #02 → #05 | ~1.6% | ~$75 |
This is an important distinction between an owner-occupier premium and an investment premium.
An owner-occupier can rationally pay $150,000 more because they personally value the view every day.
A landlord needs the tenant to monetise that preference.
How much margin for error is there?
Because Robertson Opus is incomplete, stress-test the rental estimate rather than treat it as a point forecast.
Take a base rent of $4,000. A 10% downside produces $3,600. A 10% upside produces $4,400.
For a $6,250 2BR, the corresponding range is $5,625–$6,875.
The gross-yield sensitivity therefore looks approximately like this:
| Unit category | -10% rent | Base | +10% rent |
|---|---|---|---|
| Stack 34 at ~$1.288m | ~3.35% | 3.73% | ~4.10% |
| Stack 41 at ~$1.508m | ~3.33% | 3.70% | ~4.07% |
| #02-17 | ~3.00% | 3.33% | ~3.66% |
| #02-20 | ~3.00% | 3.34% | ~3.67% |
That is a more useful way of thinking about an uncompleted investment than arguing whether the eventual rent will be $6,100 or $6,200.
The bigger unknown is the rental market at completion, along with how many Robertson Opus owners try to lease their units at the same time.
Gross yield is not cash yield
Every yield in this analysis is a gross rental yield:
Gross Rental Yield=(Monthly Rent×12)/Purchase Price
It does not deduct maintenance fees, property tax, vacancy, leasing commission, repairs, furnishing, appliance replacement, insurance, financing costs or income tax.
A nominal 3.7% gross yield is therefore not equivalent to a 3.7% annual cash return.
This matters most when comparing a brand-new condominium with an older development. Robertson Opus may initially have lower repair expenditure, but buyers must also factor in maintenance charges before making a meaningful net-yield comparison.
Conclusion: what the rental yield tells us
The rental evidence provides a reasonably clear framework for underwriting the rentals at The Robertson Opus, although actual rents at completion will ultimately depend on market conditions at that time.
One of the clearest findings is that tenure does not appear strongly related to rental performance. The 99-year Up@Robertson Quay records some of the highest rental psf figures among the developments examined, while freehold and long-tenure projects appear across a wide range of rental outcomes. For tenants, factors such as location, unit size, condition, layout and overall product appeal appear more immediately relevant than tenure.
The second finding is the strong relationship between unit size and rental psf. Smaller apartments can command significantly higher rents per square foot because tenants ultimately decide based on total monthly rent rather than a uniform neighbourhood psf rate. This is particularly relevant to Robertson Opus, where the compact Suite and 1-bedroom units require relatively modest absolute rents to generate comparatively high rental psf.
Product differentiation also matters. RiverGate demonstrates that the usual size-versus-psf relationship is not absolute: larger apartments can still command strong rental psf when the development offers sufficient quality, positioning and tenant appeal. Robertson Opus’s new-build status could therefore provide some rental advantage over older surrounding developments, although the extent of that premium remains to be tested after completion.
Against this backdrop, the rental assumptions used in this analysis provide a reasonable present-market underwriting framework, rather than a forecast of what Robertson Opus will definitely achieve at completion. The smaller units have stronger comparable support, particularly from compact apartments at Up@Robertson Quay and UE Square. Our rental assumptions for Robertson Opus’s 2-bedroom units sit closer to the upper end of the comparable rental range, reflecting their smaller unit sizes and correspondingly higher potential rental psf. They should therefore be treated with slightly greater caution.
Using the discounted purchase prices, the selected smaller units generate estimated gross yields of approximately 3.6%–3.7%, compared with roughly 3.1%–3.3% for the 2-bedroom units. That difference is significant. It suggests that, from a rental-income perspective, the smaller Robertson Opus units currently offer greater yield headroom, while the investment case for the 2-bedroom units depends more heavily on achieving stronger absolute rents.
Floor premiums should also be considered carefully. Paying substantially more for a higher-floor unit improves the investment proposition only if tenants are willing to pay enough additional rent to offset the higher purchase price. This is particularly relevant to Stack 20, where the difference between #02 and #10 is approximately S$152,000. A better view or higher floor may be desirable, but that does not automatically mean it produces a proportionate improvement in rental return.
Ultimately, however, rental yield answers only half of the investment question.
The Robertson Opus may achieve attractive rents, but that does not necessarily mean every unit represents attractive value at its purchase price. A 999-year new launch can generate a respectable rental return and still be expensive if buyers are paying too large a premium over surrounding resale alternatives. Conversely, a lower initial yield may still be justified if the entry price, product quality and longer-term capital-value proposition are sufficiently compelling.
Part 1 therefore establishes what these units at The Robertson Opus could reasonably earn based on today’s rental market. Part 2 addresses the more important question for a buyer: how much should you actually be willing to pay for them?
Disclaimer: This article is provided for general information, market commentary and educational purposes only and does not constitute financial, investment, legal or property advice, nor an offer, recommendation or solicitation to buy, sell or lease any property.
All prices, discounts, unit availability, rental figures, rental yields, transaction data, floor areas and other information are based on sources believed to be reliable at the time of writing but may be subject to change and have not been independently guaranteed. Any rental figures and projected yields stated in this article are estimates based on current market data and assumptions and should not be interpreted as guaranteed future rental income or investment returns.
In particular, The Robertson Opus is expected to be completed several years from the date of this analysis. Actual rents achievable upon completion may differ materially due to prevailing market conditions, competing rental supply, interest rates, economic conditions, unit condition, furnishings, floor level, facing, tenant demand and other factors.
Gross rental yields shown do not account for expenses such as property tax, maintenance fees, vacancy periods, agent commissions, repairs, furnishing costs, financing costs, insurance or other ownership expenses. Actual net returns may therefore be materially lower.
Past rental and transaction performance of neighbouring developments does not guarantee the future performance of The Robertson Opus. Buyers should conduct their own due diligence, verify the latest pricing and unit availability, and seek appropriate professional advice before making any property purchase or investment decision. The author may be involved in the marketing or sale of properties discussed in this article.
Article contributed by Jerry Wong.

Jerry Wong is a realtor at Propnex Realty, bringing a rich background in interior and lighting design to his work. He loves exploring diverse spaces and observing the transformative power of real estate. Beyond his professional role, Jerry finds his greatest fulfillment in connecting people with the right properties, gaining immense satisfaction from helping clients achieve their dreams.