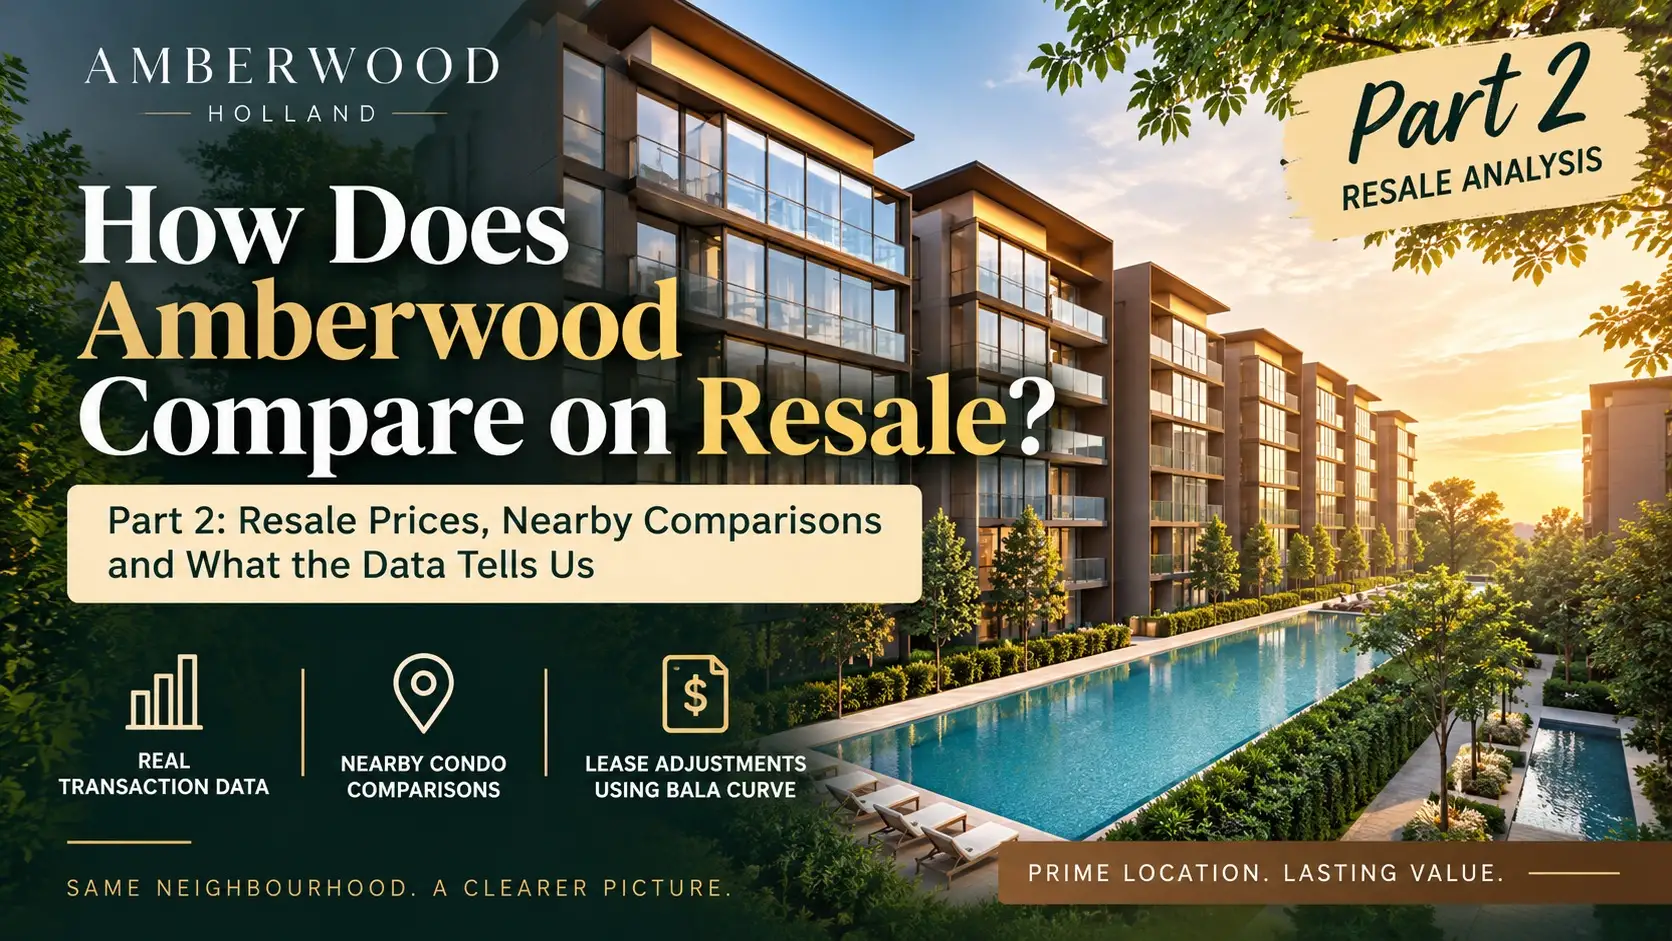
In Part 1, we looked at Amberwood at Holland through the rental lens. This second part tackles the other half of the investment equation: are buyers paying a sensible price relative to what existing condos around Bukit Timah, King Albert Park and Sixth Avenue are already transacting at?
At first glance, the answer seems easy. Amberwood’s publicly announced starting prices work out to approximately S$2,945 psf for the three-bedroom, S$2,921 psf for the four-bedroom and S$2,990 psf for the five-bedroom. Those numbers are considerably higher than many resales around King Albert Park and Old Holland Road.
But comparing the headline PSF alone would be misleading.
We need to make two major adjustments. First, Amberwood is built under the newer GFA-harmonised framework, and its floor plans explicitly exclude RC ledges and air-conditioning ledges from strata area. Second, Amberwood itself is a 99-year leasehold development commencing on 4 November 2025, so freehold comparables such as Royalgreen, Floridian and The Cascadia deserve a tenure premium, while older 99-year projects such as Fourth Avenue Residences and the Mayfair developments require a much smaller lease-age adjustment.
Once we make both adjustments, the picture changes quite substantially.
Executive summary
Our key conclusion from the resale analysis is that Amberwood is not cheap relative to the broader Bukit Timah resale market, but its entry units appear considerably more reasonable than the most relevant premium resale alternatives.
For three-bedroom buyers, the strongest references are Royalgreen and Fourth Avenue Residences. Recent three-bedroom resales at Royalgreen have generally been around S$2,850–S$2,980 psf, while Fourth Avenue Residences recorded transactions at S$2,798 and S$2,851 psf. After normalising for differences in GFA treatment and tenure, our base-case premium-resale benchmark is approximately S$2,993 psf. Against this, Amberwood’s C1 entry unit at around S$2,945 psf appears broadly fair and, under our model, marginally below the premium-resale benchmark.
For the four-bedroom category, Fourth Avenue Residences provides one of the closest physical comparisons. Its most relevant transaction is a 1,076 sq ft four-bedroom unit that sold for S$2.82 million, or S$2,620 psf, in December 2025 — almost identical in size to Amberwood’s 1,076 sq ft D1 and only 11 sq ft smaller than the 1,087 sq ft D2. Together with a second 1,475 sq ft transaction at S$2,637 psf, the two 2025 sales produce a simple midpoint of approximately S$2,629 psf. After applying our area-and-tenure normalisation, the Fourth Avenue benchmark rises to roughly S$2,800 psf. Amberwood’s D2 starting price of S$3.175 million, or approximately S$2,921 psf, therefore represents a modest premium of around 4% to 5%. For a new development with a fresh lease and GFA-harmonised floor plans, that premium appears reasonably justifiable, although the limited Fourth Avenue transaction sample means the comparison should not be treated as a precise valuation benchmark.
The five-bedroom comparison is less conclusive because very few genuinely comparable 1,300–1,600 sq ft five-bedroom resale units exist in the surrounding clusters. Larger four-bedroom units at projects such as Royalgreen and Fourth Avenue Residences therefore serve as more practical proxies for large families. Against the strongest adjusted references of around S$2,800–S$2,804 psf, Amberwood’s entry five-bedroom at approximately S$2,990 psf carries a premium of roughly 6% to 7%. That seems reasonable for a brand-new unit that fits five actual bedrooms into just 1,335 sq ft, but it should be viewed as a configuration advantage rather than evidence that Amberwood is undervalued.
The more challenging part of Amberwood’s pricing emerges as buyers move beyond the entry units. Our modelling places the upper-tier three-, four- and five-bedroom configurations at approximately S$3,276, S$3,191 and S$3,174 psf, respectively. At these levels, the premium over nearby adjusted resale benchmarks becomes considerably more pronounced. The investment case therefore appears strongest near the entry price of each bedroom category; further up the price curve, buyers increasingly need to justify the additional premium through the specific unit’s floor, facing, layout, specifications, scarcity and Premium or Luxe attributes.
The Numbers At A Glance
| Amberwood type | Harmonised Amberwood area used | Strongest resale reference | Recent resale PSF | Base adjusted PSF* | Implied resale-equivalent value | Amberwood entry price | Difference | Illustrative gross yield** |
|---|---|---|---|---|---|---|---|---|
| 3BR C1 | 872 sq ft | Royalgreen + Fourth Avenue | ~S$2,888 median | ~S$2,993 | ~S$2.61m | S$2.568m | ~1.6% below | ~3.27% at S$7,000 rent |
| 4BR D2 | 1,087 sq ft | Fourth Avenue Residences | ~S$2,629 midpoint | ~S$2,800 | ~S$3.04m | S$3.175m | ~4%–5% above | ~3.21% at S$8,500 rent |
| 5BR E1P | 1,335 sq ft | Large 4BR proxies in Royalgreen + Fourth Avenue | ~S$2,770 median | ~S$2,872 | ~S$3.83m | S$3.992m | ~4.1% above | ~3.31% at S$11,000 rent |
* Base adjusted PSF incorporates the 5% analytical GFA-area adjustment and Bala-based tenure normalisation explained below. For the four-bedroom comparison, Fourth Avenue’s adjusted benchmark is based on its two 2025 four-bedroom transactions, with the 1,076 sq ft sale providing the closest physical match to Amberwood’s 1,087 sq ft D2.
** Rental figures are round sensitivity assumptions included only to relate this article to Part 1. They are not forecasts and are not used to determine the resale-value conclusion.
Our preliminary verdict is that Amberwood’s entry units are more reasonably positioned than a simple comparison with S$2,000–S$2,500 psf Bukit Timah resales might suggest. The three-bedroom entry unit sits close to the adjusted premium-resale benchmark, while the four-bedroom D2 carries a relatively modest premium of around 4% to 5% over the closest Fourth Avenue comparison. The five-bedroom entry price also requires a moderate premium over the large-family resale proxies.
Overall, the relative-value case appears strongest at the lower-PSF entry units. As buyers move toward the larger Premium and Luxe configurations, the premium over nearby resale alternatives increases, and the margin of safety narrows considerably.
How the comparison is normalised
Before looking at the three clusters, we need to solve two problems that make the headline PSF figures deceptive.
Why GFA harmonisation changes the comparison
Under URA’s current GFA framework, areas included within a unit’s strata boundary are generally counted towards GFA. For example, URA states that where an air-conditioning ledge forms part of the strata area, it is computed as GFA, while qualifying non-strata AC and RC ledges may be treated differently under the planning rules.
Amberwood illustrates the effect of these harmonisation rules particularly clearly.
Its C1 three-bedroom unit, for example, is stated as 81 sq m, or 872 sq ft, including a 6 sq m balcony. Importantly, the floor-plan specifies that all RC ledges and AC ledges are excluded from the strata area. The same approach is applied across its larger four- and five-bedroom layouts.
This creates an important issue when comparing Amberwood with older, pre-harmonisation developments. A 900 sq ft unit in an older project should not automatically be treated as providing exactly the same amount of comparable internal-and-balcony strata space as a 900 sq ft unit at Amberwood. Part of the reported strata area in an older development may include AC ledges, RC ledges or other areas that would be treated differently under the current framework.
However, no reliable universal percentage can convert every older condominium’s reported strata area into a directly comparable harmonised figure. The amount attributable to AC ledges, RC ledges, voids, and other such spaces varies by development, unit type, and floor plan.
Rather than assign a false level of precision, we therefore use a sensitivity analysis.
Our base-case assumption is a 5% reduction in the reported strata area of pre-harmonisation comparables. We also test 3% and 7% adjustments later to show how different assumptions affect the results.
Under the 5% base case, an older 1,000 sq ft unit would therefore be treated as having approximately 950 sq ft of comparable area.
The adjustment also affects the effective price per square foot. Because the same transaction price is divided by a smaller comparable area, the adjusted psf will be higher.
For example, a resale condominium transacting at S$2,500 psf on a 5%-adjusted comparable-area basis would translate to approximately
($2500/0.95)=S$2,632 psf
This does not mean that every older condominium contains exactly 5% of non-comparable or less-usable space. The adjustment is a modelling assumption, not a measurement of any particular unit.
Its purpose is to create a more balanced comparison and avoid penalising Amberwood simply because its stated strata areas exclude certain ledges that older developments may have historically included within their strata boundaries.
Why the Bala adjustment is smaller than many buyers expect
The second misconception concerns tenure.
Amberwood is not freehold. The development sits on the remainder of a 99-year lease commencing on 4 November 2025.
This matters because several of our comparables are freehold, including Royalgreen and The Cascadia, while Mayfair Modern and Fourth Avenue Residences are 99-year developments from 2018. Royalgreen is freehold; The Cascadia is also freehold, while Mayfair Modern’s lease commenced on 18 September 2018.
Bala’s Table expresses a leasehold interest as a percentage of equivalent freehold value. Commonly cited reference points from the Singapore leasehold table are approximately 96.0% at 99 years, 94.6% at 90 years, 91.0% at 80 years, 80.0% at 60 years and 60.0% at 30 years. The curve is deliberately non-linear: lease decay is gentle while the lease is young and becomes much more material later.
| Remaining Lease |
% of Freehold Value |
Remaining Lease |
% of Freehold Value |
Remaining Lease |
% of Freehold Value |
|---|---|---|---|---|---|
| 1 year | 3.8% | 37 years | 66.2% | 73 years | 87.5% |
| 2 years | 7.5% | 38 years | 67.0% | 74 years | 88.0% |
| 3 years | 10.9% | 39 years | 67.7% | 75 years | 88.5% |
| 4 years | 14.1% | 40 years | 68.5% | 76 years | 89.0% |
| 5 years | 17.1% | 41 years | 69.2% | 77 years | 89.5% |
| 6 years | 19.9% | 42 years | 69.8% | 78 years | 90.0% |
| 7 years | 22.7% | 43 years | 70.5% | 79 years | 90.5% |
| 8 years | 25.2% | 44 years | 71.2% | 80 years | 91.0% |
| 9 years | 27.7% | 45 years | 71.8% | 81 years | 91.4% |
| 10 years | 30.0% | 46 years | 72.4% | 82 years | 91.8% |
| 11 years | 32.2% | 47 years | 73.0% | 83 years | 92.2% |
| 12 years | 34.3% | 48 years | 73.6% | 84 years | 92.6% |
| 13 years | 36.3% | 49 years | 74.1% | 85 years | 92.9% |
| 14 years | 38.2% | 50 years | 74.7% | 86 years | 93.3% |
| 15 years | 40.0% | 51 years | 75.2% | 87 years | 93.6% |
| 16 years | 41.8% | 52 years | 75.7% | 88 years | 94.0% |
| 17 years | 43.4% | 53 years | 76.2% | 89 years | 94.3% |
| 18 years | 45.0% | 54 years | 76.7% | 90 years | 94.6% |
| 19 years | 46.6% | 55 years | 77.3% | 91 years | 94.8% |
| 20 years | 48.0% | 56 years | 77.9% | 92 years | 95.0% |
| 21 years | 49.5% | 57 years | 78.5% | 93 years | 95.2% |
| 22 years | 50.8% | 58 years | 79.0% | 94 years | 95.4% |
| 23 years | 52.1% | 59 years | 79.5% | 95 years | 95.6% |
| 24 years | 53.4% | 60 years | 80.0% | 96 years | 95.7% |
| 25 years | 54.6% | 61 years | 80.6% | 97 years | 95.8% |
| 26 years | 55.8% | 62 years | 81.2% | 98 years | 95.9% |
| 27 years | 56.9% | 63 years | 81.8% | 99 years | 96.0% |
| 28 years | 58.0% | 64 years | 82.4% | Freehold 100% |
|
| 29 years | 59.0% | 65 years | 83.0% | ||
| 30 years | 60.0% | 66 years | 83.6% | ||
| 31 years | 61.0% | 67 years | 84.2% | ||
| 32 years | 61.9% | 68 years | 84.5% | ||
| 33 years | 62.8% | 69 years | 85.4% | ||
| 34 years | 63.7% | 70 years | 86.0% | ||
| 35 years | 64.6% | 71 years | 86.5% | ||
| 36 years | 65.4% | 72 years | 87.0% | ||
How to read the table:
The percentage represents the indicative value of the remaining lease relative to an equivalent freehold interest. For example, a property with 60 years remaining corresponds to approximately 80% of freehold land value under the table, while 30 years corresponds to around 60%.
80–99 years
60–79 years
40–59 years
34–39 years
20–33 years
Below 20 years
Important: Bala’s Table / the Leasehold Table is a land valuation reference. It should not be interpreted as a direct prediction of how much an individual condominium, apartment or HDB flat will appreciate or depreciate.
For this analysis, we linearly interpolate only between the relevant young-lease anchor points. This gives Amberwood, with roughly 98 years remaining as of September 2026, an approximate Bala factor of:
Amberwood Bala Factor ≈ 0.959
For a 2018 99-year project with approximately 90–91 years remaining:
2018 Comparable Bala Factor ≈ 0.948
We then convert every comparable into an Amberwood-equivalent tenure:
Amberwood Equivalent PSF ≈ GFA Adjusted PSF x (Amberwood Bala Factor/Comparable Bala Factor)
For a freehold project:
Freehold Bala Factor ≈ 1
so:
For a 2018 99-year project:
Amberwood Equivalent PSF ≈ GFA Adjusted PSF x (0.959/0.948)
or approximately 1.01 times the area-adjusted PSF.
This leads to a counterintuitive but important result.
At our 5% GFA assumption, a freehold resale’s PSF receives approximately a 5.3% uplift from the area adjustment, followed by roughly a 4.1% discount when converted from freehold to Amberwood’s leasehold tenure. The two effects almost cancel:
0.959/0.95 ≈ 1.009
So a typical older freehold comparable’s final adjusted PSF is only around 0.9% higher than its raw PSF in our base model.
For a 2018 leasehold comparable:
(0.965/0.948)/0.95 ≈ 1.065
giving an overall adjustment of approximately +6.5%.
This is why Fourth Avenue Residences should not receive a huge lease-decay discount when compared with Amberwood. Both are young 99-year leasehold projects; only about seven to eight years separate their lease commencements. On Bala’s curve, that difference near the top of the curve is relatively modest.
Bala’s Table itself should also not be mistaken for an exact condo valuation formula. It isolates lease relativity; it does not capture building age, renovation, floor, view, MRT distance, project branding, facilities, redevelopment expectations or market sentiment. Those factors remain embedded in the actual resale transaction.
How the resale transactions were selected and compared
PropNex’s extraction of URA private residential transactions covers new sales, resales and sub-sales. URA states that resale and sub-sale records are derived primarily from caveats lodged with the Singapore Land Authority (SLA). As caveat lodgement is not mandatory, these records may not capture every transaction. URA’s broader REALIS methodology therefore supplements caveat data with transaction information obtained from other government sources.
For this article, we focus principally on transactions from the latest 12–24 months, using the most comparable bedroom categories and sizes available. Where a project has very few suitable sales, we state that limitation rather than filling the sample with much older transactions.
The Adjustment Process
- Recent resale transaction–> Select same bedroom type or nearest family-size equivalent
- Start with reported strata area and transacted PSF
- Apply 3%-7% GFA-harmonisation sensitivity range
- Base case: 5% area adjustment
- Apply Bala tenure factor
- Convert to Amberwood-equivalent PSF
- Multiply by matching Amberwood floor area
- Compare implied resale-equivalent value with Amberwood launch price
- Stress-test entry price versus upper-tier pricing
In other words, we are deliberately not asking, “Which condo has the lowest PSF?”
We are asking:
After putting the floor areas and tenure onto a more comparable basis, how much of a premium is Amberwood actually asking buyers to pay?
Three-bedroom resale comparison
The three-bedroom segment provides the strongest data set because all three clusters contain relevant transactions.
Amberwood’s smallest C1 three-bedroom is 872 sq ft and starts from S$2.568 million, or about S$2,945 psf. Its other three-bedroom configurations range from 893 to 980 sq ft.
King Albert Park cluster
The King Albert Park group records the lowest PSF, although it also comprises the most diverse mix of properties.
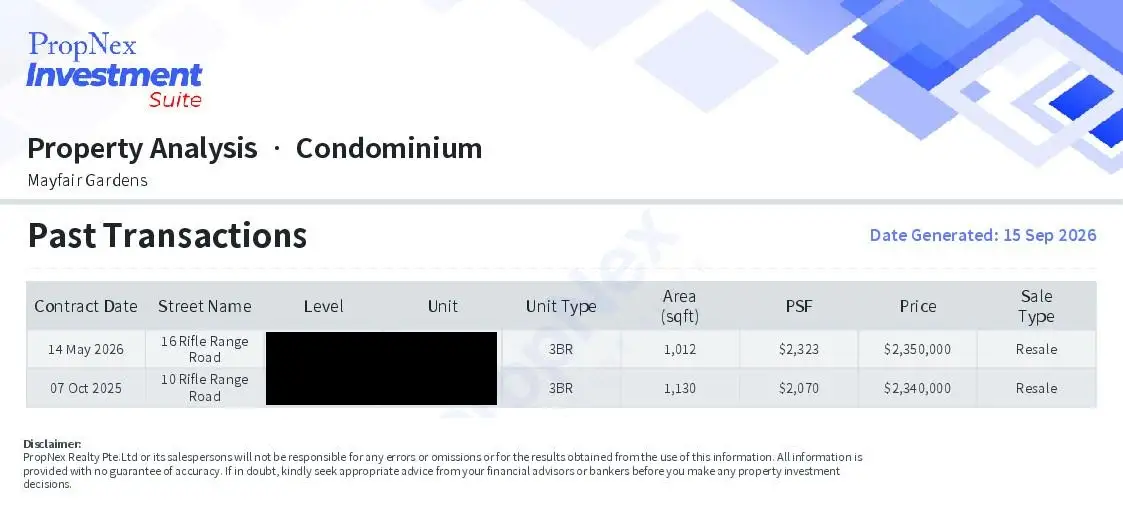
Mayfair Gardens recorded recent three-bedroom sales including 1,012 sq ft at S$2.35 million or S$2,322 psf and 1,130 sq ft at S$2,071 psf.
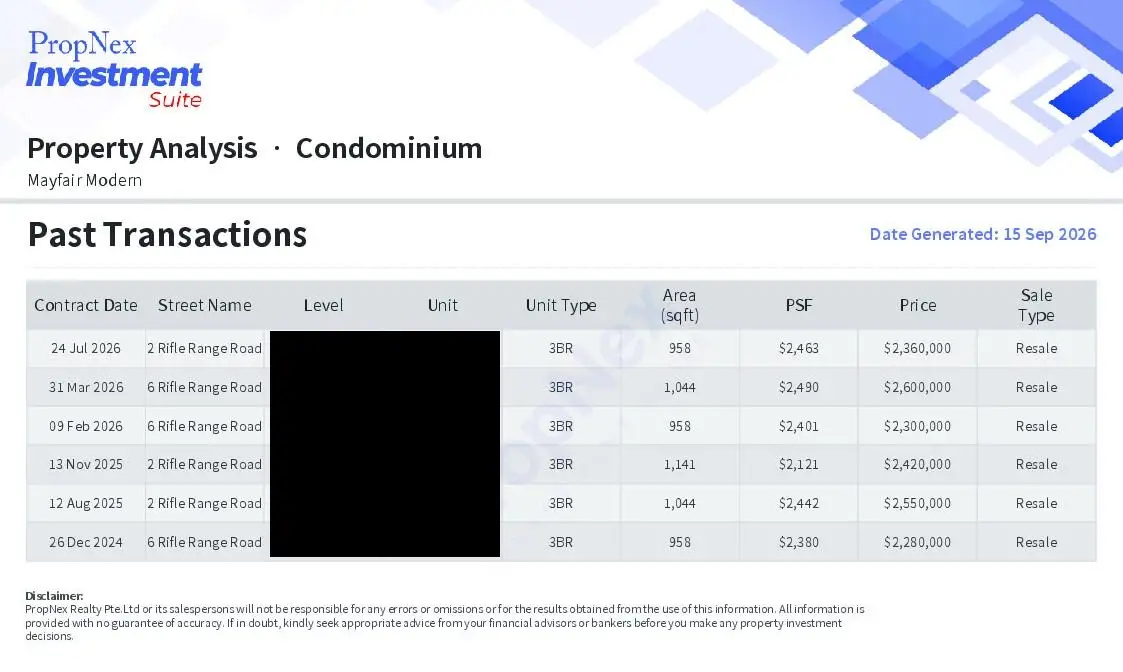
Mayfair Modern has more recent sales data. Recent three-bedroom caveats include 958 sq ft at S$2,463 psf in July 2026, 1,044 sq ft at S$2,490 psf, another 958 sq ft at S$2,401 psf, and 1,044 sq ft at S$2,443 psf.
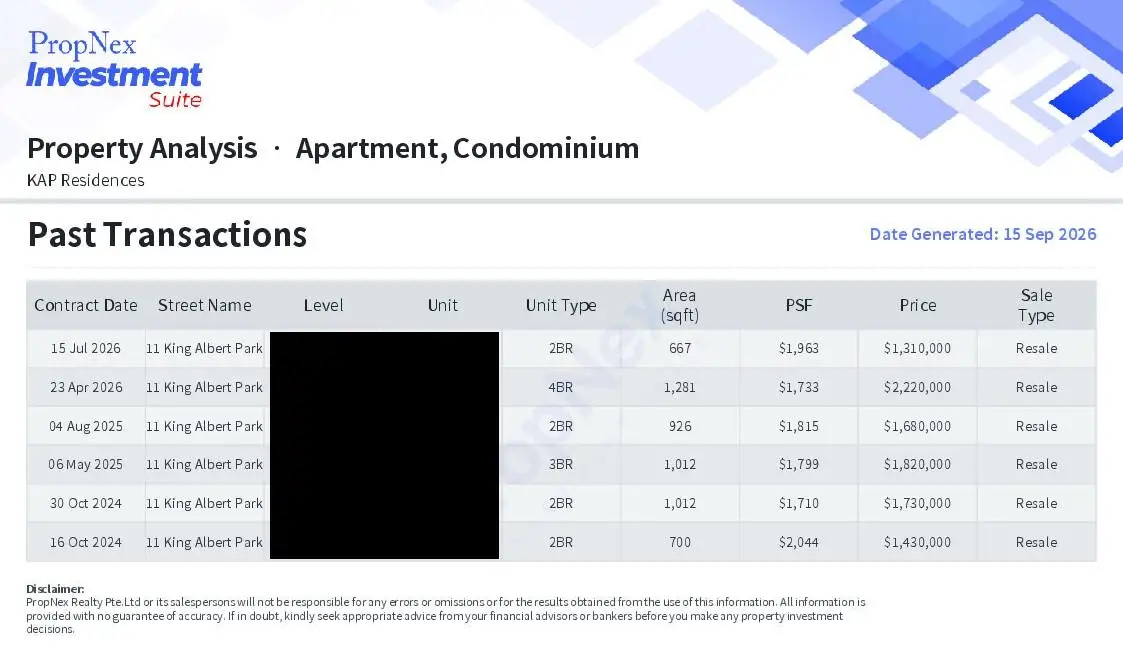
KAP Residences is harder to compare with Amberwood on bedroom count alone because its unit sizes vary considerably across standard, penthouse and PES configurations. For example, its July 2026 two-bedroom + study transaction involved just 667 sq ft at S$1,964 psf, while a recent four-bedroom penthouse sale was substantially larger at 1,281 sq ft. The latest available three-bedroom resale transaction, recorded in May 2025, was also unusual: a 1,012 sq ft unit with a significant PES component changed hands for S$1.82 million, or S$1,799 psf. These variations mean bedroom labels alone can be misleading when benchmarking KAP Residences against Amberwood; you need to consider actual unit size, configuration, and the proportion of usable internal space alongside PSF.
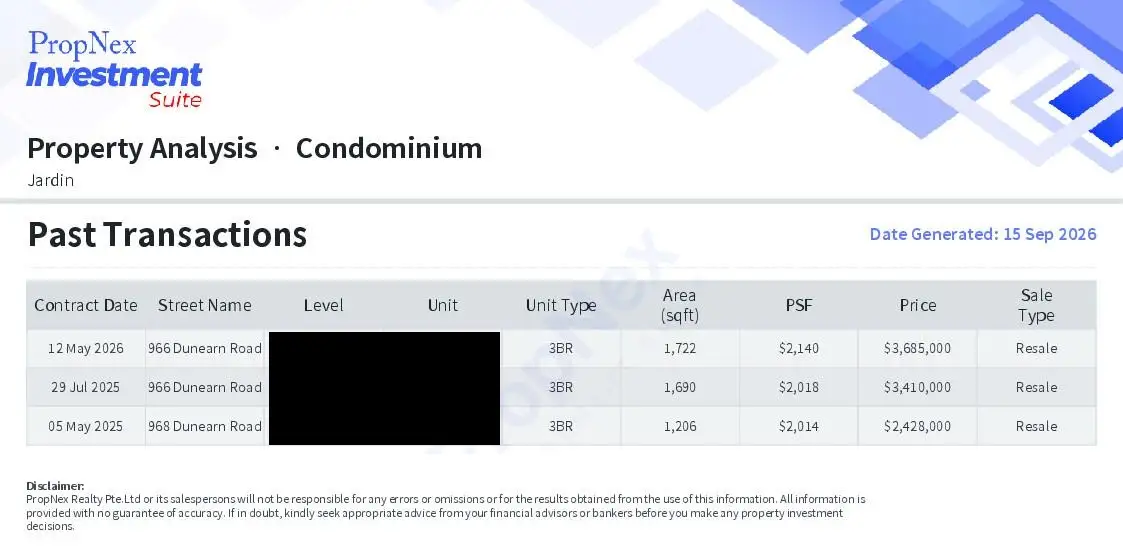
Jardin presents the opposite problem: its family-sized units are considerably larger, making it a useful broader freehold Bukit Timah benchmark but less useful as a direct substitute for an 872–980 sq ft Amberwood three-bedder. Recent Jardin transactions have generally sat around the low-S$2,000 psf region.
Old Holland Road cluster
This cluster produces a noticeably higher benchmark.
Floridian’s recent three-bedroom resale transactions show a relatively wide price range, with 1,356 to 1,701 sq ft units changing hands at between S$2,382 and S$2,564 psf in 2025. The highest PSF among these transactions was S$2,564 psf for a 1,658 sq ft unit sold for S$4.25 million, while the largest 1,701 sq ft unit fetched S$4.08 million, or S$2,399 psf.
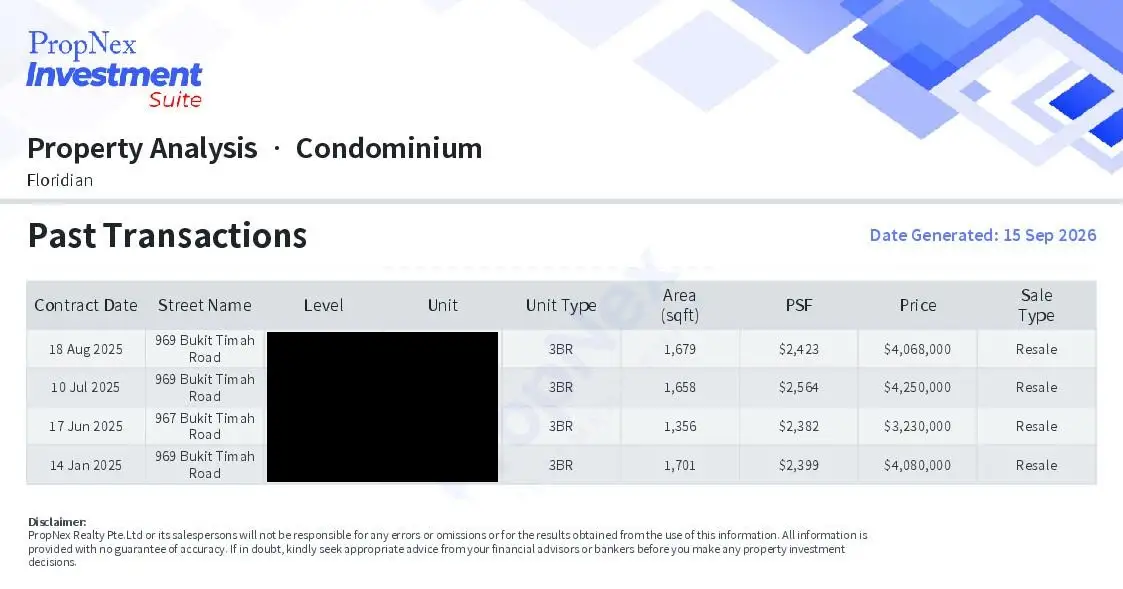
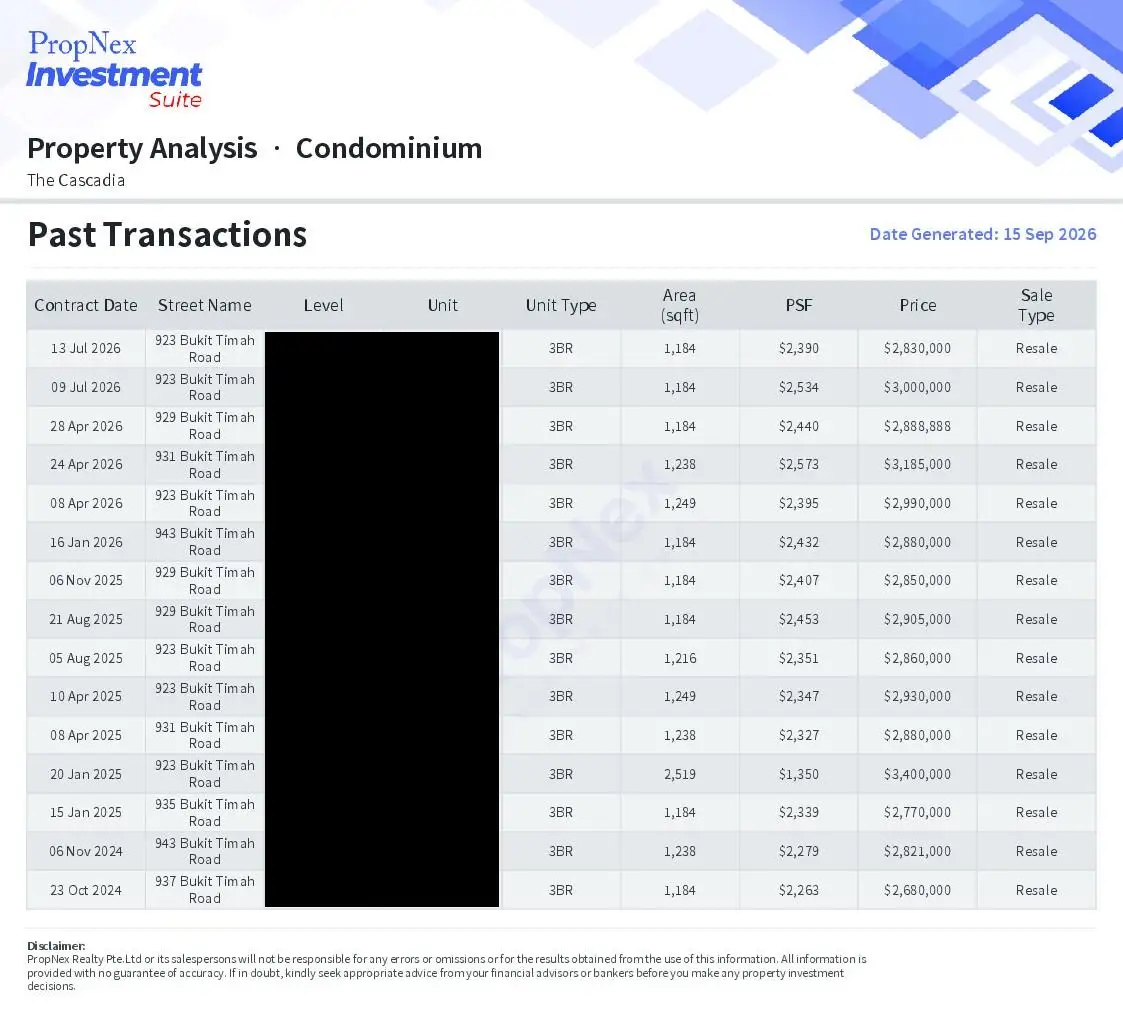
The Cascadia has been particularly active. Recent three-bedroom sales include 1,184 sq ft transactions at S$2,390, S$2,534 and S$2,440 psf, while a 1,238 sq ft unit changed hands at S$2,573 psf.
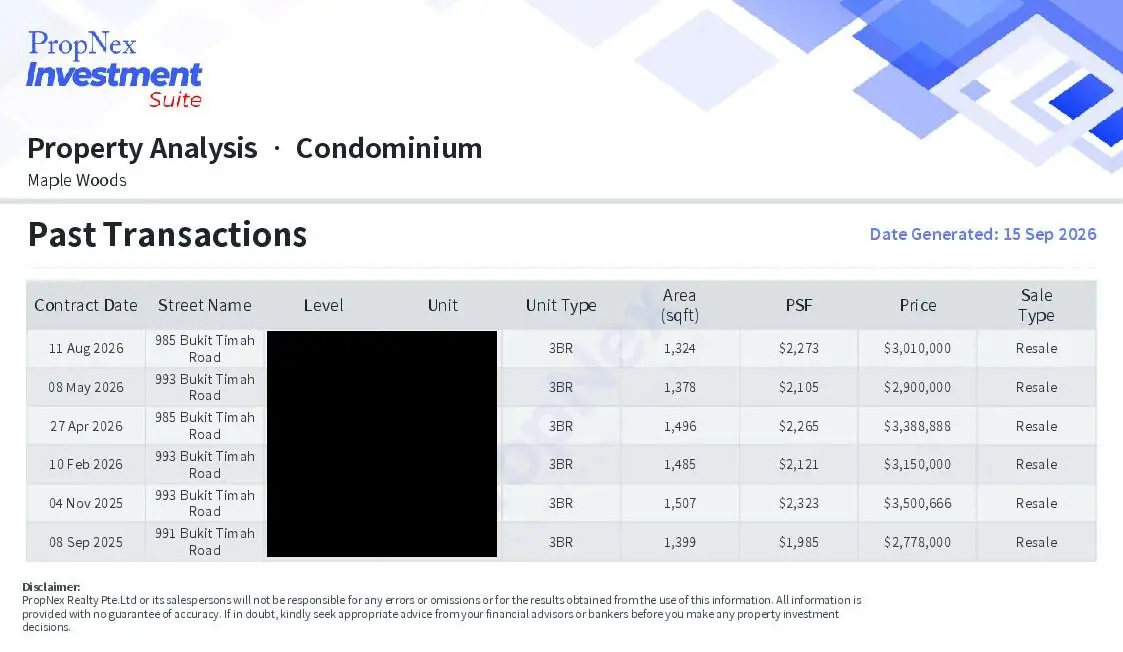
Maple Woods remains cheaper on a PSF basis. The 2026 transactions include 1,378 sq ft at S$2,105 psf, 1,485 sq ft units around S$2,121 psf and 1,496 sq ft at S$2,265 psf. Its 2026 median was reported around S$2,154 psf.
Royalgreen and Fourth Avenue
This is where the comparison becomes much more relevant for Amberwood.
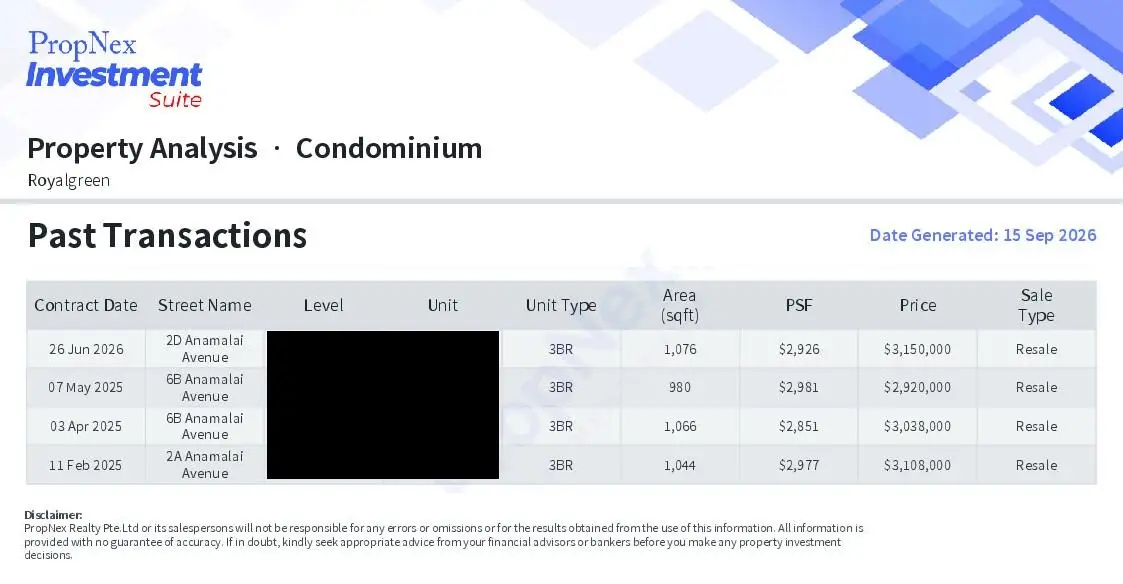
Royalgreen recorded a 1,076 sq ft three-bedroom sale at S$3.15 million or S$2,926 psf in June 2026. Earlier recent three-bedroom transactions include 980 sq ft at S$2,981 psf, 1,066 sq ft at S$2,850 psf and 1,044 sq ft at S$2,977 psf. It is also freehold.
Fourth Avenue Residences recorded 947 sq ft three-bedroom transactions at S$2,798 psf in June 2026 and S$2,851 psf in August 2025. Because the physical size is very close to Amberwood’s 958 and 980 sq ft three-bedroom options, this is arguably one of the most useful direct references in the entire exercise.
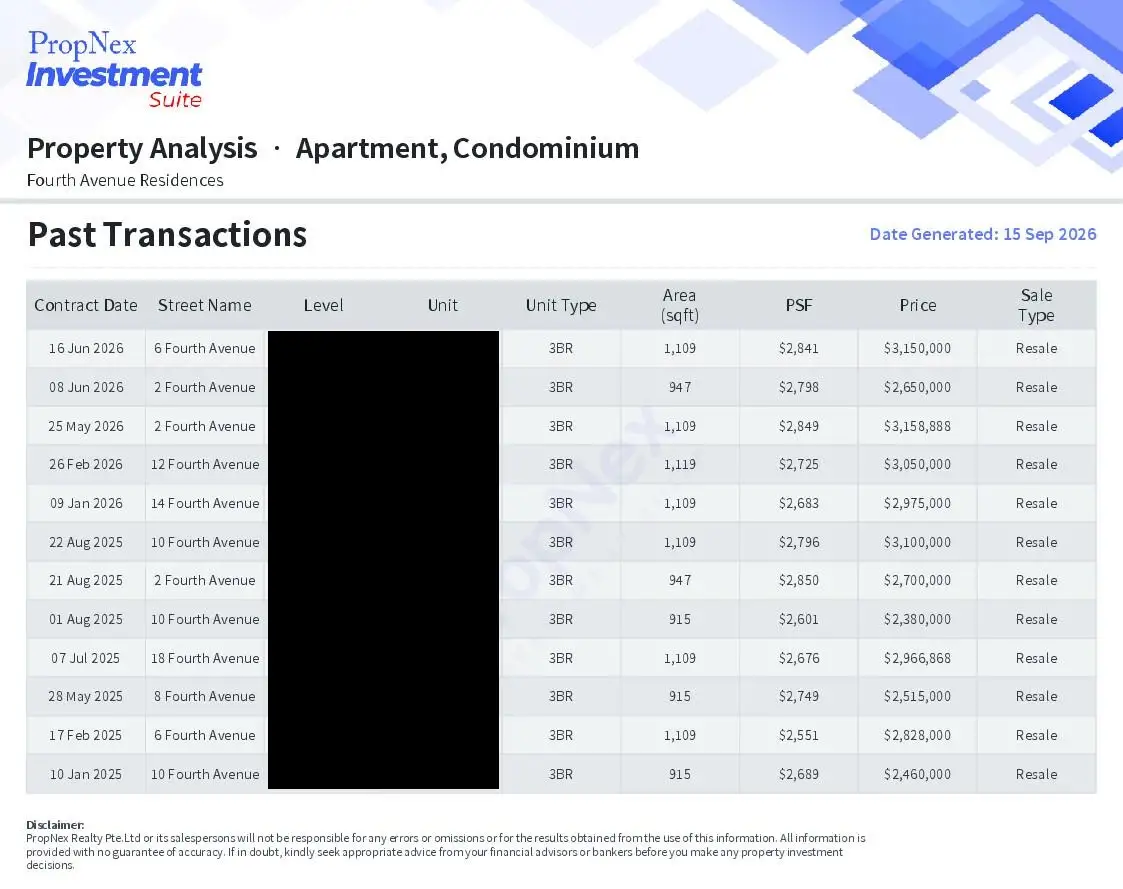
Three-bedroom normalised comparison
The following table uses the median PSF and representative area of the relevant recent transactions described above. The “harmonised area” is our 5% analytical adjustment, not an official re-survey of the resale unit.
| Cluster/project | Closest Comparison Area (sqft) | Assumed harmonised area (sqft) | Recent median PSF | Amberwood-Bala adjusted PSF | Implied value at Amberwood C1’s 872 sq ft |
| KAP — Jardin | 1,206 | ~1,145 | ~S$2,018 | ~S$2,036 | ~S$1.78m |
| KAP — Mayfair Gardens | 931 | ~884 | ~S$2,091 | ~S$2,227 | ~S$1.94m |
| KAP — Mayfair Modern | 958 | ~910 | ~S$2,336 | ~S$2,487 | ~S$2.17m |
| KAP — KAP Residences* | 667 | ~634 | ~S$1,964 | ~S$1,982 | ~S$1.73m |
| Old Holland — Floridian | 1356 | ~1427 | ~S$2,477 | ~S$2,499 | ~S$2.18m |
| Old Holland — The Cascadia | 1,184 | ~1,125 | ~S$2,432 | ~S$2,454 | ~S$2.14m |
| Old Holland — Maple Woods | 1,485 | ~1,411 | ~S$2,210 | ~S$2,230 | ~S$1.94m |
| Sixth Ave — Royalgreen | 1,044 | ~992 | ~S$2,951 | ~S$2,978 | ~S$2.60m |
| Sixth Ave — Fourth Avenue Residences | 947 | ~900 | ~S$2,825 | ~S$3,008 | ~S$2.62m |
| Amberwood C1 | 872 | 872 | — | S$2,945 launch PSF | S$2.568m |
*We used the 2-bedroom transactions at KAP due to the large PES area of the single 3-bedroom transaction
The “implied value” column is not a valuation of a particular unit. It simply asks what an 872 sq ft Amberwood-equivalent unit would cost if the adjusted resale PSF were applied to Amberwood’s C1 floor area.
The contrast is clear.
The adjusted median for the King Albert Park cluster is only around S$2,130 psf, while the Old Holland cluster is roughly S$2,450 psf on the same basis. Amberwood therefore commands a substantial premium to both.
But the Royalgreen/Fourth Avenue premium cluster averages about S$2,993 psf after adjustment.
Against that:
(2945/2993) -1 ≈ -1.6%
Amberwood’s three-bedroom entry PSF is therefore approximately 1.6% below the Sixth Avenue benchmark in the base model.
That is a very different conclusion from simply saying that Amberwood is launching at “almost S$3,000 psf while nearby resale condos are S$2,000–S$2,500 psf.”
The chart also illustrates why the selection of comparables matters. Amberwood is priced at a clear premium to Jardin, Mayfair Gardens, KAP Residences and Maple Woods, but the gap narrows considerably when compared with Royalgreen and lease-adjusted Fourth Avenue Residences, which sit within a more comparable pricing range.
For an owner-occupier who sees Royalgreen and Fourth Avenue as the more realistic alternatives, the three-bedroom entry price is therefore surprisingly competitive.
The caveat comes at the upper end.
Using our earlier +25% upper-tier sensitivity:
$2.568m x 1.25 ≈ $3.21m
Applied to Amberwood’s 980 sq ft C4S:
$3.21m/980 $3,276 psf ≈ $3,276 psf
That is approximately 9.5% above the S$2,993 psf premium resale benchmark.
So there are effectively two different Amberwood three-bedroom investment cases:
At around S$2,945 psf, the entry-level pricing appears reasonably supportable against the surrounding comparables. However, once prices rise to S$3,250–S$3,300 psf, buyers pay a larger premium for Amberwood’s new-launch status, as well as the specific stack, facing, and unit configuration.
Four-bedroom resale comparison
The four-bedroom category is arguably even more revealing because Amberwood offers several family-sized configurations while keeping its entry layouts unusually compact.
The D1 starts at 1,076 sq ft, followed by the D2 at 1,087 sq ft and D3F at 1,141 sq ft. Buyers who want larger configurations can move into the Premium and Luxe variants at 1,227, 1,249, 1,259 and eventually 1,313 sq ft.
Importantly, the stated areas exclude the RC and AC ledges identified as non-strata areas under the GFA harmonisation framework. This makes Amberwood’s stated square footage somewhat different from that of many older developments, where certain ledges may have formed part of the strata area.
The official starting price of S$3.175 million corresponds to the 1,087 sq ft D2:
S$3.175 million ÷ 1,087 sq ft = approximately S$2,921 psf
That means buyers can enter Amberwood’s four-bedroom category below S$3,000 psf despite getting four bedrooms within a relatively compact 1,087 sq ft footprint.
Fourth Avenue Residences remains useful — but the evidence is much thinner in the 4-bedroom case
Fourth Avenue Residences is still one of the most relevant physical comparisons for Amberwood, but the transaction evidence needs to be treated much more cautiously.
According to the latest transaction, there were only two four-bedroom resale transactions in 2025:
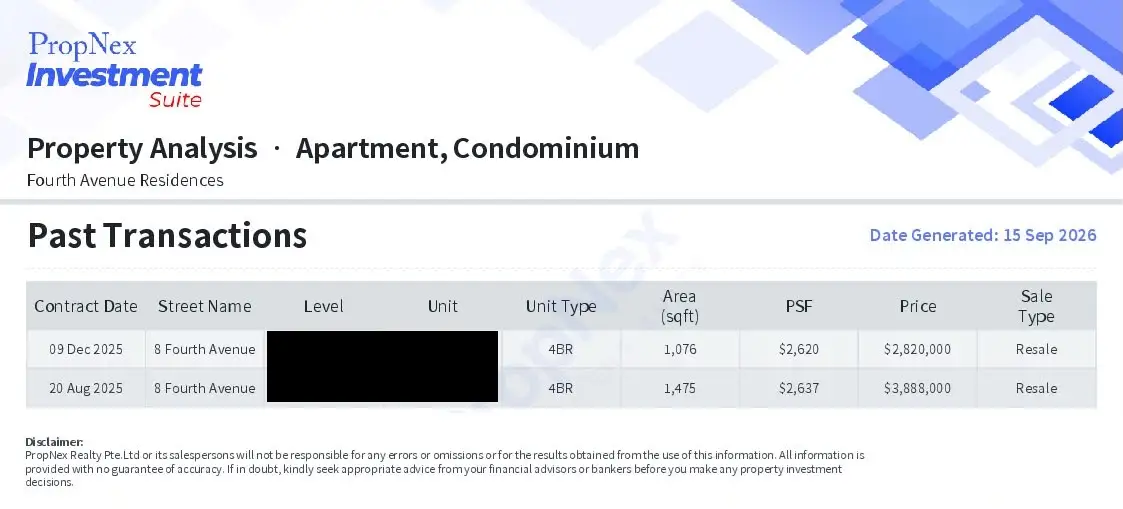
The most important transaction is therefore the 1,076 sq ft sale at S$2,620 psf.
Its floor area is almost identical to Amberwood’s 1,076 sq ft D1 and only 11 sq ft smaller than the 1,087 sq ft D2 used for our entry-price comparison.
That makes it an unusually clean size comparison even though there is only one directly size-matched transaction.
The second Fourth Avenue sale, at 1,475 sq ft and S$2,637 psf, provides useful supporting evidence that larger four-bedroom units were also trading around the mid-S$2,600s psf, but it should not be treated as equally comparable because it is substantially larger than Amberwood’s entry configurations.
Across the two transactions, the simple midpoint is approximately:
(S$2,620 + S$2,637) ÷ 2 = S$2,629 psf
Using the same base-case methodology we adopted — a 5% adjustment to approximate differences in older strata-area conventions followed by tenure normalisation — the Fourth Avenue benchmark rises to roughly:
S$2,800 psf
Our methodology assumes a 5% area adjustment for pre-harmonisation projects, while the lease adjustment for relatively young leasehold developments is comparatively modest.
Applied to Amberwood’s 1,087 sq ft D2, this produces an indicative Fourth Avenue-equivalent value of approximately:
1,087 sq ft × S$2,800 psf = S$3.04 million
Amberwood’s starting price is S$3.175 million.
The difference is therefore approximately:
S$3.175m − S$3.04m = S$135,000, or roughly 4% to 5%.
This shows Amberwood is asking buyers to pay a modest premium over the closest size-matched Fourth Avenue resale transaction.
The more important question is whether that premium is reasonable.
For the additional amount, the Amberwood buyer receives a brand-new development, a fresh 2025 lease, contemporary specifications and a GFA-harmonised floor plan. Fourth Avenue Residences, on the other hand, is already completed and provides immediate occupation within an established Bukit Timah project.
A premium of around 4% to 5% is therefore not obviously excessive, but neither should it be described as a discount.
The limited Fourth Avenue sample also changes how much weight we should give it
There is another important methodological point.
Two transactions are not enough to establish a particularly robust market benchmark.
And of those two sales, only the 1,076 sq ft unit is almost directly comparable with Amberwood’s entry four-bedroom layouts.
Fourth Avenue Residences should therefore remain in the comparison because the physical similarity is unusually strong, but it should no longer dominate the valuation exercise.
Royalgreen, The Cascadia, Floridian and the broader Bukit Timah resale market become useful secondary references even though their unit sizes and tenure characteristics are less directly comparable.
The corrected conclusion is therefore:
Fourth Avenue Residences provides a very useful size-matched datapoint, but not a sufficiently large transaction sample to establish Amberwood’s four-bedroom fair value by itself.
How the other four-bedroom alternatives compare
The remaining resale projects illustrate why bedroom count alone can be misleading.
KAP Residences recorded a 1,281 sq ft four-bedroom sale at approximately S$1,733 psf in April 2026. However, this transaction is not directly comparable with Amberwood’s conventional four-bedroom layouts because the unit is a penthouse configuration with a private roof terrace and jacuzzi.
Its 1,281 sq ft strata area therefore reflects a very different type of product, with part of the value proposition tied to the outdoor terrace and penthouse lifestyle rather than purely to internal living space. While its much lower PSF helps establish the lower end of the surrounding resale market, it should carry less weight as a direct benchmark for Amberwood’s more conventional, GFA-harmonised four-bedroom apartments.
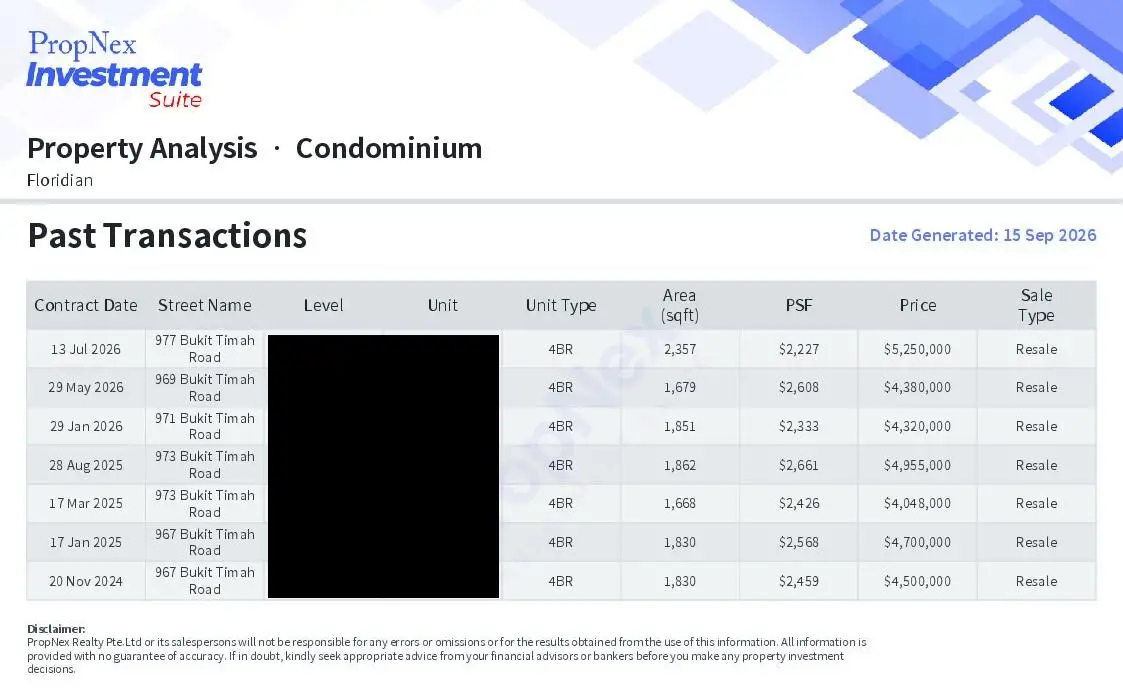
Floridian’s recent large four-bedroom transactions have ranged widely, including units around 1,679 sq ft, 1,852 sq ft and 1,862 sq ft.
These are substantially larger homes than Amberwood’s compact D1, D2 and D3F layouts. They may offer considerably more absolute living space, but they also require a much higher overall quantum if buyers want similar locations and larger floorplates.
The Cascadia sits somewhere in between. Recent four-bedroom transactions include approximately 1,410 sq ft at S$2,518 psf, 1,421 sq ft at around S$2,399 psf and 1,496 sq ft units in the low-to-mid S$2,300s psf.
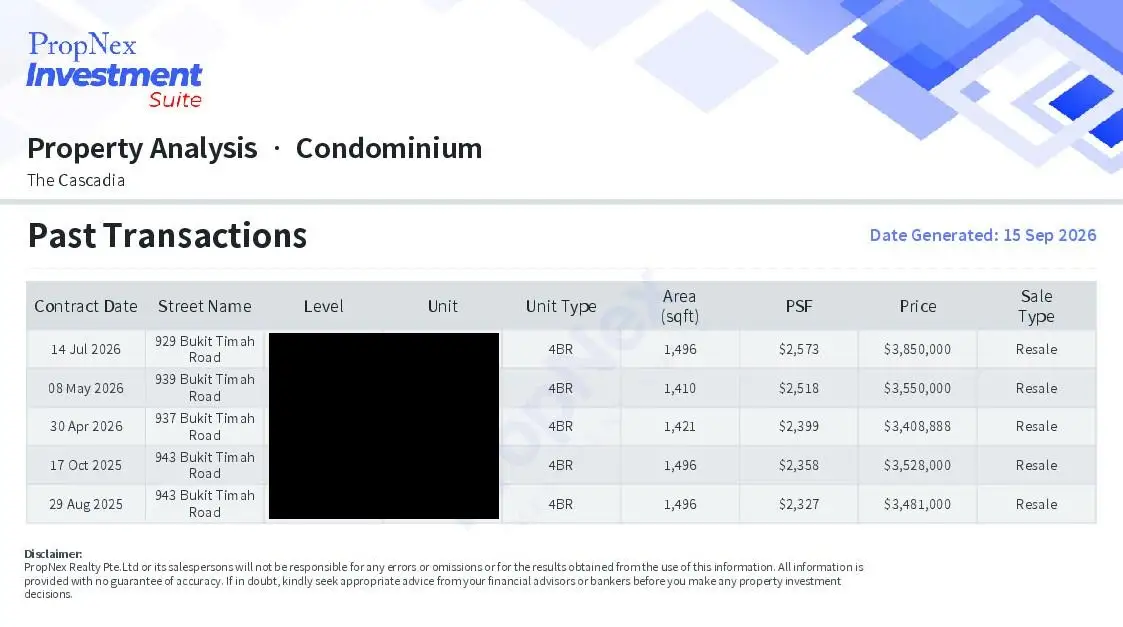
Again, these homes are much larger than Amberwood’s entry four-bedders.
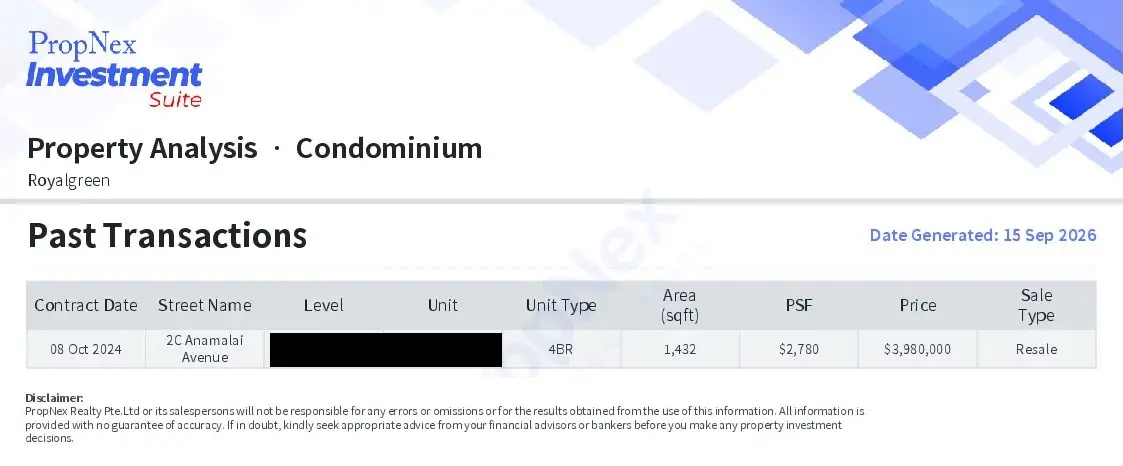
Royalgreen remains a useful premium Bukit Timah reference because it is significantly newer than many older resale alternatives and is freehold. However, its recent four-bedroom transaction evidence is relatively thin. A 1,432 sq ft four-bedroom transaction at approximately S$2,779 psf in October 2024 provides a useful indication, but it deserves less weight because of both its larger size and older transaction date.
Four-bedroom normalised comparison
| Project | Closest Comparison Area (sqft) | Assumed harmonised area (sqft) | Recent median PSF | Amberwood-Bala adjusted PSF | Implied value at Amberwood’s D2 1087 sq ft |
|---|---|---|---|---|---|
| Jardin | ~1,895 sq ft | ~1,800 sq ft | ~S$1,900 | ~S$1,917 | ~S$2.08m |
| Mayfair Gardens | ~1,733 sq ft | ~1,646 sq ft | ~S$2,083 | ~S$2,218 | ~S$2.41m |
| KAP Residences* | ~1,281 sq ft | ~1,217 sq ft | ~S$1,733 | ~S$1,750–1,800 | ~S$1.90m |
| Floridian | ~1,679 sq ft | ~1,595 sq ft | ~S$2,425 | ~S$2,447 | ~S$2.66m |
| The Cascadia | ~1,459 sq ft | ~1,386 sq ft | ~S$2,379 | ~S$2,400 | ~S$2.61m |
| Maple Woods, large-unit proxy | ~1,787 sq ft | ~1,698 sq ft | ~S$2,337 | ~S$2,358 | ~S$2.56m |
| Royalgreen* | 1,432 sq ft | ~1,360 sq ft | S$2,779 | ~S$2,804 | ~S$3.05m |
| Fourth Avenue Residences | 1,076–1,475 sq ft | ~1,022–1,401 sq ft | ~S$2,629 midpoint | ~S$2,800 | ~S$3.04m |
| Amberwood D2 | 1,087 sq ft | 1,087 sq ft | — | S$2,921 launch PSF | S$3.175m |
*The KAP Residences is a duplex penthouse unit comprising an open roof terrace and jacuzzi
**Royalgreen’s relevant four-bedroom transaction is older and should therefore carry lower weight.
What is particularly useful about Fourth Avenue is not its transaction volume but the existence of the 1,076 sq ft transaction. At almost exactly the same floor area as Amberwood’s entry D1 and D2, it gives us one of the cleanest physical comparisons available.
Amberwood is at approximately S$2,921 psf versus around S$2,800 psf on an adjusted Fourth Avenue basis.
That represents a premium of roughly:
S$2,921 ÷ S$2,800 − 1 ≈ 4.3%
For a brand-new development with a fresh lease, that does not look excessive.
But it is still a premium. That distinction matters.
What happens at the upper end of Amberwood’s four-bedroom range?
The investment case becomes less compelling as buyers move toward the larger Premium and Luxe units.
Using the same illustrative 32% upper-tier sensitivity adopted earlier, the larger 1,313 sq ft D7L works out to approximately:
S$3,190 psf
Against Fourth Avenue’s corrected adjusted benchmark of around S$2,800 psf, that represents a premium of approximately:
14%
Against Royalgreen’s adjusted benchmark of roughly S$2,804 psf, the result is almost identical. The distinction between entry and upper-tier Amberwood therefore becomes much clearer.
At around S$2,921 psf, the entry four-bedroom asks buyers to pay a relatively modest new-project premium over the strongest resale evidence.
At around S$3,190 psf, the buyer pays a much larger premium that needs to be justified by stack, floor, facing, layout, specifications, and Luxe positioning.
The D7L is obviously not the same product as the entry D2. Buyers may reasonably pay more for a larger and better-configured unit.
But from a pure resale-comparison perspective, the margin of safety is clearly lower.
Five-bedroom and large-family comparison
The five-bedroom category requires a different approach.
Amberwood provides genuine five-bedroom layouts starting at approximately 1,324–1,335 sq ft, while the larger Luxe configurations expand to 1,496, 1,561 and 1,572 sq ft.
That is unusually compact for five bedrooms.
The difficulty is that very few genuine five-bedroom resale units nearby provide a meaningful like-for-like comparison.
The Cascadia technically has five-bedroom units, but much of its five-bedroom stock consists of very large penthouses exceeding 4,700 sq ft. Comparing those units directly with a 1,335 sq ft Amberwood apartment would tell us very little.
Its standard four-bedroom layouts around 1,410–1,593 sq ft are actually much closer physical substitutes.
Royalgreen presents the same issue.
Its approximately 1,432 sq ft four-bedroom layouts are arguably closer in physical scale to Amberwood’s 1,335 sq ft five-bedroom than many nominal five-bedroom units elsewhere.
For this part of the analysis, usable family capacity and unit size therefore matter more than the bedroom label itself.
Estimated large-family unit proxy comparison
| Project | Resale proxy | Assumed harmonised area (sqft) | Reference PSF | Amberwood-Bala adjusted PSF | Implied value at Amberwood’s D2 1087 sq ft |
|---|---|---|---|---|---|
| Jardin | Large 4BR | ~1,800 sq ft | ~S$1,900 | ~S$1,917 | ~S$2.56m |
| Mayfair Gardens | Large 4BR | ~1,646 sq ft | ~S$2,083 | ~S$2,218 | ~S$2.96m |
| Floridian | Large 4BR | ~1,595 sq ft | ~S$2,425 | ~S$2,447 | ~S$3.27m |
| The Cascadia | Large 4BR | ~1,386 sq ft | ~S$2,379 | ~S$2,400 | ~S$3.20m |
| Maple Woods | Large-family proxy | ~1,698 sq ft | ~S$2,337 | ~S$2,358 | ~S$3.15m |
| Royalgreen* | 1,432 sq ft 4BR | ~1,360 sq ft | S$2,779 | ~S$2,804 | ~S$3.74m |
| Fourth Avenue Residences | 4BR proxy | ~1,022–1,401 sq ft | ~S$2,629 | ~S$2,800 | ~S$3.74m |
| Amberwood E1P | Actual 5BR | 1,335 sq ft | — | S$2,990 launch PSF | S$3.992m |
*Royalgreen’s relevant four-bedroom transaction is older and therefore carries lower evidential weight.
Amberwood’s entry five-bedroom at approximately S$2,990 psf is around:
6.8% above Fourth Avenue’s adjusted benchmark
and approximately:
6.6% above Royalgreen’s adjusted benchmark
The midpoint of the two premium resale references is about:
S$2,802 psf
That means Amberwood’s S$2,990 psf entry five-bedroom represents a premium of roughly:
6.7%
That still does not look unreasonable for a brand-new genuine five-bedroom unit.
The corrected conclusion should therefore be more measured:
Amberwood’s entry five-bedroom appears to command a mid-single-digit premium over the strongest nearby large-family resale proxies. The justification lies primarily in its newness, fresh lease and ability to fit five actual bedrooms into only 1,335 sq ft.
For a household that genuinely needs five bedrooms, that configuration could have significant practical value.
The alternative may not be another five-bedroom condominium.
It may instead be a 1,400–1,800 sq ft four-bedroom unit, which can substantially increase the absolute purchase quantum even when the resale PSF is lower.
But investors should not confuse that configuration advantage with proof that Amberwood is undervalued.
Larger five-bedroom Luxe units require more justification
At the upper end, the argument becomes harder.
Using the earlier 25% upper-tier modelling sensitivity and the 1,572 sq ft E5L produces an indicative PSF of approximately:
S$3,174 psf
Against the roughly S$2,800–S$2,804 adjusted premium-resale references, this represents approximately a:
13% premium
At that point, buyers are no longer purchasing primarily because Amberwood looks inexpensive relative to resale projects.
The justification instead needs to come from the unit’s actual attributes: larger configuration, Luxe specifications, private-lift arrangements where applicable, stack, facing, floor, newness, and scarcity.
Amberwood’s larger five-bedroom variants reach approximately 1,496–1,572 sq ft, making them meaningfully different products from the entry layouts.
Sensitivity, caveats and what these numbers really mean
No matter how precise a PSF table appears, the result remains dependent on the assumptions used. There are several areas where buyers should be particularly careful.
The GFA adjustment matters more than the lease adjustment for young projects
Our base case assumes that approximately 5% should be removed from the headline strata area of pre-harmonisation projects for comparison purposes.
This is not a claim that every older condominium contains exactly 5% of non-comparable strata space. It is simply a modelling assumption.
The sensitivity looks like this:
| Assumed area adjustment | Freehold comparable: total PSF multiplier after tenure normalisation | 2018 leasehold comparable: total PSF multiplier | Interpretation |
|---|---|---|---|
| 3% | ~0.988× | ~1.043× | Freehold PSF slightly lower after full adjustment |
| 5% base case | ~1.009× | ~1.065× | Freehold almost unchanged; younger leasehold rises ~6.5% |
| 7% | ~1.031× | ~1.088× | Larger effective-PSF uplift |
The important lesson is that the area assumption can influence the result more than the tenure adjustment when the leasehold development is still relatively young.
That is why buyers should not simply compare an older condominium’s raw PSF directly against Amberwood’s launch PSF.
But equally, the adjustment should not be pushed so aggressively that it automatically makes the new launch look cheap.
A new development deserves some premium — but we have deliberately not invented one
Amberwood’s expected vacant possession is 30 June 2030, and its lease commences in 2025. Our model does not automatically add an arbitrary 5%, 10% or 15% “new-launch premium.”
That is intentional.
New developments can command premiums because buyers receive newer finishes, facilities, building systems, design standards and a longer remaining lease.
But the size of that premium should ultimately be determined by market behaviour, not inserted into a spreadsheet merely to justify a launch price.
Amberwood is already approximately 4% above the adjusted Fourth Avenue benchmark before we assign any explicit value to newness. That premium therefore appears explainable, rather than demonstrating obvious undervaluation.
At the upper end, however, the premium expands toward approximately 14%.
Buyers should then ask exactly what unit-specific attributes they are receiving in exchange.
Upper-Tier Pricing: Why We Use Modelling Assumptions
The exact pricing of Amberwood’s higher-floor, Premium and Luxe units can vary significantly from the advertised starting prices. To account for this, we use publicly available starting prices as our baseline and apply a sensitivity analysis to show how pricing could increase as buyers move toward more premium units within each bedroom category.
This shows how Amberwood’s investment proposition changes as buyers move away from entry units and pay progressively higher prices for attributes such as floor level, facing, larger layouts, and Premium or Luxe configurations.
| Category | Public entry quantum | Upper-tier modelling assumption | Modelled upper quantum | Large layout used | Approx. upper PSF | Illustrative monthly rent | Illustrative yield |
|---|---|---|---|---|---|---|---|
| 3BR | S$2.568m | +25% | ~S$3.21m | 980 sq ft | ~S$3,276 | S$7,500 | ~2.80% |
| 4BR | S$3.175m | +32% | ~S$4.19m | 1,313 sq ft | ~S$3,191 | S$10,000 | ~2.86% |
| 5BR | S$3.992m | +25% | ~S$4.99m | 1,572 sq ft | ~S$3,174 | S$13,000 | ~3.13% |
The 25%, 32% and 25% figures remain modelling assumptions rather than developer quotations.
Rental yield should likewise remain a secondary cross-check rather than the basis for manufacturing a resale valuation.
Verdict: Is Amberwood at Holland a good buy compared with nearby resale condos?
The answer depends substantially on which Amberwood unit the buyer chooses.
For the entry-level three-bedroom, the relative-value case remains compelling.
At approximately S$2,945 psf, Amberwood initially looks expensive beside developments such as Mayfair Gardens, Jardin, KAP Residences, Maple Woods and The Cascadia.
But those projects are not equally strong substitutes.
Once the more relevant premium resale projects are adjusted for differences in floor-area conventions and tenure, Amberwood’s entry three-bedroom sits much closer to the prevailing premium-resale market than the raw PSF numbers initially suggest.
At S$2.568 million for 872 sq ft, the buyer is therefore not necessarily paying a huge speculative premium simply because Amberwood is a new launch. The stronger interpretation is that the entry three-bedroom appears broadly within the fair-value range established by nearby premium resale alternatives.
Four-bedroom: A modest premium over the closest resale comparison
Amberwood’s 1,087 sq ft D2 starts at S$3.175 million, or approximately S$2,921 psf.
The closest size-matched comparison at Fourth Avenue Residences is a 1,076 sq ft four-bedroom unit that sold for S$2.82 million, or S$2,620 psf, in December 2025. The size difference is just 11 sq ft, making this one of the most relevant physical comparisons available.
After applying our area-and-tenure normalisation methodology, the Fourth Avenue transaction translates to an Amberwood-equivalent benchmark of roughly S$2,800 psf.
Against this benchmark, Amberwood’s entry four-bedroom carries a premium of approximately 4% to 5%.
That premium appears relatively defensible. In exchange, the Amberwood buyer gets a brand-new development, a fresh 2025 lease and a GFA-harmonised layout where the stated strata area excludes the relevant RC and AC ledges.
However, the Fourth Avenue evidence should not be overstated. Only two four-bedroom transactions were recorded in 2025, and only the 1,076 sq ft transaction provides a particularly close size match to Amberwood’s entry layouts.
The more measured conclusion is therefore that Amberwood’s entry four-bedroom appears reasonably priced rather than obviously cheap. Its S$2,921 psf starting price represents a modest premium over the closest size-matched resale evidence, but the difference is not large enough on its own to suggest that Amberwood is significantly overpriced.
The five-bedroom is a configuration story rather than a pure PSF story
Amberwood’s entry five-bedroom at S$3.992 million and approximately S$2,990 psf sits around 6% to 7% above the strongest adjusted large-family resale proxies.
That is not negligible, but it’s also not particularly extreme for a brand-new project.
More importantly, buyers are getting five actual bedrooms within approximately 1,335 sq ft. Very few genuinely comparable resale five-bedroom units nearby are that size.
The real question is whether the buyer values Amberwood’s ability to deliver five bedrooms within a relatively compact, GFA-harmonised footprint.
For a large household that genuinely requires five bedrooms, the answer could be yes.
For an investor focused primarily on PSF arbitrage, the case is much less obvious.
Amberwood becomes progressively less compelling as buyers move up the price curve
This remains one of the most important conclusions from the analysis.
At entry pricing, Amberwood generally sits within a plausible premium-resale valuation band. Once buyers move toward the larger Premium and Luxe configurations, the relationship changes.
Our modelling places the upper-tier units at approximately:
- 3BR: ~S$3,276 psf
- 4BR: ~S$3,191 psf
- 5BR: ~S$3,174 psf
At those levels, buyers are paying a much clearer premium over today’s adjusted resale evidence. That does not automatically make those units poor purchases.
A superior stack, higher floor, better view, private lift, larger living spaces or Luxe specifications can legitimately command more. But the investment proposition changes.
At entry pricing, the argument is:
“I am buying a brand-new Amberwood at a relatively modest premium to the strongest nearby resale alternatives.”
At upper-tier pricing, the argument becomes:
“I am intentionally paying materially more than nearby resale values because this specific unit offers attributes that I personally value.”
Those are fundamentally different purchase decisions.
Relative-valuation scorecard
| Amberwood segment | Revised assessment | Why |
|---|---|---|
| 3BR entry | Attractive / fair-to-good value | Entry PSF remains close to adjusted premium-resale evidence |
| 3BR upper tier | Premium pricing | ~S$3,276 psf requires stronger stack/layout justification |
| 4BR entry | Fair value | ~S$2,921 psf versus ~S$2,800 adjusted Fourth Avenue benchmark; roughly 4% premium |
| 4BR upper tier | Premium pricing | ~S$3,191 psf is approximately 14% above the strongest corrected premium-resale references |
| 5BR entry | Fair, but configuration-dependent | ~6%–7% premium to large-family proxies, offset by genuine 5BR configuration |
| 5BR upper tier | Premium / unit-specific value | ~S$3,174 psf sits materially above broad resale alternatives |
Final Assessment
Amberwood at Holland does not look uniformly cheap, nor does it look uniformly expensive.
The more useful conclusion is that value appears strongest near the entry price of each bedroom category and progressively weaker as buyers move toward the more expensive stacks and Luxe configurations.
For the four-bedroom category in particular, the available evidence suggests that Amberwood carries a modest premium over the closest comparable resale units. However, the difference is relatively small and does not appear excessive.
At approximately S$2,921 psf versus an adjusted Fourth Avenue benchmark of around S$2,800 psf, the difference is only about 4% to 5%.
For a new development with a fresh lease and floor plans designed under the harmonised GFA framework, this modest premium appears reasonably justified.
The bigger risk lies further up Amberwood’s price curve.
Once the effective purchase price moves into the S$3,150–S$3,300 psf region, the buyer is increasingly paying for the specific unit rather than the project’s underlying relative value.
That means stack, facing, floor, layout efficiency, Premium or Luxe specifications and scarcity become considerably more important.
For buyers focused primarily on capital preservation, the strategy is therefore relatively straightforward:
Secure the lower end of the relevant bedroom category wherever possible, rather than assuming every unit within Amberwood offers the same investment proposition.
Amberwood’s headline PSF may attract the most attention, but the real distinction is not whether the number starts with a “2” or a “3”.
It is how much premium the individual unit asks buyers to pay over credible resale alternatives—and whether that unit’s attributes are sufficient to justify it.
Disclaimer: This article is provided for general information and discussion purposes only and does not constitute financial, investment, legal, tax or property advice, nor an offer or recommendation to purchase any property. Prices, discounts, unit availability, transaction data, rental information, yields, promotional terms and other figures are based on information available at the time of writing and may change without notice. Historical transactions, comparable developments and rental records do not guarantee future prices, rental income, capital appreciation or investment performance. Comparisons between developments may also be affected by differences in tenure, unit size, floor level, orientation, layout, age, location and other property-specific factors. Buyers should independently verify all information with the developer, relevant authorities and their professional advisers, and assess their own financial circumstances and objectives before making any purchase or investment decision. The author may be involved in the marketing or sale of properties discussed in this article.
Article contributed by Jerry Wong.

Jerry Wong is a realtor at Propnex Realty, bringing a rich background in interior and lighting design to his work. He loves exploring diverse spaces and observing the transformative power of real estate. Beyond his professional role, Jerry finds his greatest fulfillment in connecting people with the right properties, gaining immense satisfaction from helping clients achieve their dreams.